Flavoured Water Market Analysis from 2022 to 2034 Containing Market Size, Share along with its CAGR, Forecast and Trends
Top Countries — Revenue
Market Dynamics of Flavoured Water Market Analysis
Growth Drivers
- Growing Consumer Preference for Healthier Beverage Options Drives the Flavoured Water Market Growth
- Increasing Demand for Flavored Beverages in Urban Areas Boost Market Growth
Restraints
- High Competition from Other Flavored Drinks and Soft Beverages, will Limit Market Growth
- Concerns Regarding Artificial Additives and Sustainability
Trends
- The Rise of Premium and Craft Flavored Waters
- Increasing Demand for Functional and Enhanced Waters
Access the full forecast model.
Country-level data · Company profiles · Editable dataset · Analyst consultation included.
Flavoured Water Market Analysis — Presence
Geographical Analysis
Click countries to exploreRegional and Country Analysis
Global Flavoured Water Market Analysis 2026
| Region / Country | 2021 (A) | 2025 (A) | 2033 (P) | CAGR |
|---|---|---|---|---|
| Global | $ 526.46 Million | $ 762.42 Million | $ 1598.98 Million | 9.7% |
| North America | $ 160.04 Million | $ 227.88 Million | $ 468.7 Million | 9.433% |
| United States | $ 123.55 Million | $ 170.76 Million | $ 343.21 Million | 9.118% |
| Canada | $ 23.46 Million | $ 35.94 Million | $ 78.74 Million | 10.302% |
| Mexico | $ 13.03 Million | $ 21.18 Million | $ 46.75 Million | 10.401% |
| Europe | $ 203.74 Million | $ 292.01 Million | $ 593.92 Million | 9.28% |
| United Kingdom | $ 30.97 Million | $ 46.14 Million | $ 100.17 Million | 10.175% |
| France | $ 26.28 Million | $ 36.72 Million | $ 72.21 Million | 8.82% |
| Germany | $ 47.06 Million | $ 66.87 Million | $ 133.63 Million | 9.04% |
| Italy | $ 18.07 Million | $ 24.53 Million | $ 47.51 Million | 8.616% |
| Russia | $ 16.5 Million | $ 23.13 Million | $ 43.34 Million | 8.163% |
| Spain | $ 12.67 Million | $ 17.77 Million | $ 33.85 Million | 8.389% |
| Sweden | $ 8.95 Million | $ 12.65 Million | $ 22.57 Million | 7.504% |
| Denmark | $ 6.84 Million | $ 9.44 Million | $ 17.82 Million | 8.271% |
| Switzerland | $ 6.75 Million | $ 9.51 Million | $ 16.63 Million | 7.239% |
| Luxembourg | $ 5.87 Million | $ 8.23 Million | $ 14.79 Million | 7.605% |
| Rest of Europe | $ 23.77 Million | $ 37.02 Million | $ 91.4 Million | 11.959% |
| Asia Pacific | $ 92.66 Million | $ 138.96 Million | $ 301.12 Million | 10.149% |
| China | $ 38.08 Million | $ 57.14 Million | $ 126.19 Million | 10.41% |
| Japan | $ 19.2 Million | $ 28.34 Million | $ 58.65 Million | 9.518% |
| South Korea | $ 8.69 Million | $ 12.8 Million | $ 27.31 Million | 9.939% |
| India | $ 4.92 Million | $ 7.72 Million | $ 18.04 Million | 11.185% |
| Australia | $ 7.21 Million | $ 10.67 Million | $ 21.68 Million | 9.266% |
| Singapore | $ 3.15 Million | $ 4.5 Million | $ 9.49 Million | 9.782% |
| Taiwan | $ 2.13 Million | $ 3.34 Million | $ 8.13 Million | 11.782% |
| South East Asia | $ 5.59 Million | $ 8.56 Million | $ 16.56 Million | 8.601% |
| Rest of APAC | xxxx | xxxx | xxxx | 12% |
| South America | $ 24.74 Million | $ 34.89 Million | $ 72.63 Million | 9.597% |
| Brazil | $ 12.59 Million | $ 17.78 Million | $ 37.57 Million | 9.804% |
| Argentina | $ 3.55 Million | $ 5.04 Million | $ 10.59 Million | 9.739% |
| Colombia | $ 2.5 Million | $ 3.56 Million | $ 7.58 Million | 9.911% |
| Peru | $ 2.08 Million | $ 2.85 Million | $ 5.65 Million | 8.938% |
| Chile | $ 1.84 Million | $ 2.55 Million | $ 5.16 Million | 9.221% |
| Rest of South America | $ 2.18 Million | $ 3.12 Million | $ 6.07 Million | 8.684% |
| Middle East | $ 23.16 Million | $ 34.4 Million | $ 75.76 Million | 10.374% |
| Saudi Arabia | $ 6.58 Million | $ 9.91 Million | $ 22.79 Million | 10.969% |
| Turkey | $ 5.07 Million | $ 7.43 Million | $ 15.94 Million | 10.016% |
| UAE | $ 4.56 Million | $ 6.96 Million | $ 16.21 Million | 11.147% |
| Egypt | $ 2.62 Million | $ 3.78 Million | $ 8.21 Million | 10.189% |
| Qatar | $ 1.81 Million | $ 2.69 Million | $ 5.99 Million | 10.511% |
| Rest of Middle East | $ 2.53 Million | $ 3.63 Million | $ 6.63 Million | 7.81% |
| Africa | $ 22.11 Million | $ 34.28 Million | $ 86.86 Million | 12.325% |
| East Africa | xxxx | xxxx | xxxx | xxxx |
| West Africa | xxxx | xxxx | xxxx | xxxx |
| North Africa | xxxx | xxxx | xxxx | xxxx |
| South Africa | $ 5.75 Million | $ 9.12 Million | $ 23.91 Million | 12.794% |
A = Actual · E = Estimated · P = Projected · 🔒 Locked values require full access. Click headers to sort.
Unlock full regional dataset →Segmentation Analysis
How are Segments Performing in the Global Flavoured Water Market? Flavoured Water Market Product Type Segment Analysis According to Cognitive Market Research, Still is likely to dominate the Flavoured Water Market over the forecast period. This is because still water is seen as a refreshing and healthy hydration option. It appeals to a wide consumer base, especially those seeking alternatives to sugary drinks. Its simplicity and neutral flavor profile make it a favorite for consumers looking for clean, easy-to-drink products without added carbonation. As health-conscious trends continue to rise, still flavored water’s position in the market remains strong, catering to a broad demographic that values natural and non-carbonated drinks. The Sparkling is the fastest-growing segment in the Flavoured Water Market. The rising popularity of carbonated beverages, paired with increasing consumer demand for healthier alternatives to sugary sodas, is driving the growth of sparkling flavored water. It offers a fizzy, refreshing experience that appeals to younger, urban consumers who prefer the combination of carbonation and natural flavors. This subsegment’s appeal as a healthier alternative to soft drinks is pushing its rapid growth, and it is anticipated to lead the market’s expansion in the coming years.
Disclaimer: The charts and graphs are for illustrative purposes only and do not represent actual market values. To access accurate quantitative data, please request a paid report or request free sample.
To learn more about market share and segmentation, request the free sample pages.
Competitor Analysis
Competitive Landscape of the Flavoured Water Market
In the flavored water market's competitive landscape, numerous key competitors are driving innovation and growth. These companies specialize in creating beverages infused with natural flavors, vitamins, and minerals that are both refreshing and health-oriented. Market rivalry is encouraging technological and flavor innovations to craft flavored water that fulfills both consumer preferences and wellness goals, keeping the market dynamic and competitive.
In August 2024, LaCroix Sparkling Water introduced its newest flavor, Strawberry Peach, which combines the sweet taste of strawberries with the juicy flavor of peaches. This refreshing beverage aims to deliver "Delightful Sips of Bliss," capturing the essence of biting into both fruits simultaneously. Initially launched at select retailers, LaCroix Strawberry Peach will soon be available nationwide, reflecting the brand's commitment to providing unique flavors and eye-catching packaging to delight consumers. (Source: https://www.businesswire.com/news/home/20240808031824/en/LaCroix%E2%80%99s-Newest-Flavor-Elicits-.-.-.-Delightful-Sips-of-Bliss%21%21-Strawberry-Peach-to-Launch-at-Select-Retailers) In January 2024, Aqua Libra launched two new ranges of plain still and sparkling water in 330ml recyclable aluminum cans, marking a significant expansion of its product offerings. These new options are designed to cater to health-conscious consumers, as they contain no sugar, sweeteners, or calories. The cans feature the "Metal Recycles Forever" logo, emphasizing the brand's commitment to sustainability and appealing to the growing demand for healthier beverage choices in the market. (Source: https://www.alcircle.com/news/aqua-libra-kickstarts-2024-with-two-new-ranges-of-flavored-water-in-330ml-aluminium-cans-105656?srsltid=AfmBOoqVmBgKi4cmMNweEX-6TkOQa3KFT86LY3xt8hKqGBBxLxmgqtuA) In March 2024, Highland Spring entered the flavored still water category with the launch of its new range, featuring three flavors: Strawberry, Apple & Blackcurrant, and Lemon & Lime. These sugar-free products combine natural flavors with Highland Spring water sourced from the Ochil Hills in Scotland, aiming to provide a healthier hydration option. The launch reflects a strategic opportunity to reinvigorate the category, leveraging the brand's strong reputation and consumer trust, and will be supported by extensive marketing efforts, including a sampling program in Tesco stores. (Source: https://www.talkingretail.com/products-news/soft-drinks/highland-spring-launches-new-flavoured-still-water-range-27-03-2024/)
| Top Companies (In no particular order) | 2022 (A) | 2023 (A) | 2024 (A) | 2025 (A) |
|---|---|---|---|---|
| Nestlé | ••• | ••• | ••• | ••• |
| Talking Rain | ••• | ••• | ••• | ••• |
| PepsiCo | ••• | ••• | ••• | ••• |
| Inc. | ••• | ••• | ••• | ••• |
| The Coca-Cola Company | ••• | ••• | ••• | ••• |
| Hint | ••• | ••• | ••• | ••• |
| Inc. | ••• | ••• | ••• | ••• |
| Spindrift | ••• | ••• | ••• | ••• |
| National Beverage Corp. | ••• | ••• | ••• | ••• |
| Sanpellegrino S.P.A. | ••• | ••• | ••• | ••• |
| KeurigDr Pepper | ••• | ••• | ••• | ••• |
| Inc. | ••• | ••• | ••• | ••• |
| Saratoga Spring Water Company | ••• | ••• | ••• | ••• |
We Provide Regional Breakdown of this Companies and Company specific to any Country, Region, Product/ service as well. We cover market share analysis for publicly listed companies as well as privately held companies, subject to data availability.
Request company profile for validation →Report Scope & Analysis
Executive Summary of Flavoured Water Market
The global flavoured water market is experiencing robust growth, projected to expand from $526.46 million in 2021 to $1,598.98 million by 2033, at a compelling CAGR of 9.7%. This expansion is primarily fuelled by a significant consumer shift away from high-sugar carbonated soft drinks and juices towards healthier, low-calorie hydration alternatives. Innovation in natural flavourings, the incorporation of functional ingredients like vitamins and minerals, and a growing emphasis on sustainable packaging are key trends shaping the market landscape. While North America and Europe currently hold the largest market shares, the Asia Pacific and African regions are emerging as high-growth frontiers, driven by rising disposable incomes and increasing health awareness. The market's trajectory is set for continued growth, contingent on manufacturers' ability to innovate and adapt to evolving consumer preferences for wellness-oriented products.
Key strategic insights from our comprehensive analysis reveal:
The health and wellness movement is the primary catalyst for market growth. Consumers are actively seeking beverages that offer hydration without the high sugar content of traditional soft drinks, creating a substantial opportunity for flavoured water products positioned as healthy alternatives.
Emerging economies, particularly in the Asia Pacific and African regions, represent the most significant growth opportunities. With CAGRs exceeding the global average, these markets are driven by rapid urbanization, rising disposable incomes, and a growing adoption of Western consumer trends.
Product innovation focused on "clean labels," functional benefits (e.g., added vitamins, electrolytes), and eco-friendly packaging is critical for brand differentiation and capturing consumer loyalty in a competitive beverage landscape.
Strategic Recommendations for Manufacturers
To succeed in the dynamic flavoured water market, manufacturers should prioritize a multi-faceted strategy. Firstly, focus on product innovation by developing unique flavour profiles with natural, "clean-label" ingredients and functional additives to cater to specific wellness needs. Secondly, invest in high-growth emerging markets in Asia Pacific and Africa, tailoring products to local tastes and price points. Thirdly, embrace sustainability by adopting eco-friendly packaging and transparently communicating these efforts to build brand equity. Finally, leverage digital marketing and social media platforms to engage with health-conscious millennials and Gen Z, who are the core demographic for this category.
Introduction of the Flavoured Water Market
The flavored water market focuses on beverages that combine water with added flavors, offering a refreshing and tasty alternative to plain water. These drinks are typically low in calories and free from artificial sweeteners, making them a popular choice among health-conscious consumers. The market has grown due to changing lifestyles and increasing awareness about the benefits of hydration. Many people prefer flavored water over sugary drinks like sodas because it provides a healthier option without compromising on taste. Key drivers for this market include rising health and fitness trends, demand for natural and organic beverages, and innovative flavor options introduced by manufacturers. Additionally, attractive packaging and marketing strategies have boosted its appeal among younger and urban populations, making flavored water a growing segment in the global beverage industry.
In May 2023, Volvic expanded its Touch of Fruit Sugar-Free range with the launch of a new Kiwi & Lime flavored still water. This product features a design that highlights the kiwi and lime ingredients, complemented by lush greenery while emphasizing its sugar-free composition. The flavor was selected through a social media poll conducted by popular influencer Kyron Hamilton, reflecting consumer preferences. (Source: https://www.packagingnews.co.uk/design/new-packs/volvic-launches-new-kiwi-lime-flavoured-still-water-12-05-2023)
Analyst Conclusion
As per Cognitive's Research Analyst, Flavoured Water are beverages positioned between plain bottled water and sugary soft drinks. They play an essential role in offering the appeal of flavour without the associated guilt of high calories and sugar.
Looking at the Historical Growth The global market expanded from $526.46 million in 2021 to an estimated $835.81 million in 2026 due to a significant consumer shift away from high-sugar carbonated soft drinks and juices towards healthier, low-calorie hydration alternatives. Regionally, Europe grew from $203.74 million in 2021 to $319.10 million in 2026, while North America progressed from $160.044 million to $249.28 million over the same period.
Currently in 2026, Europe holds a commanding 38.18% of the global market, driven by strict government regulations and sugar taxes on sweetened beverages and a strong cultural preference for sparkling water variants. The [...] segment remains the primary consumer of Flavoured Water. Additionally Africa is set to be the fastest-growing region, exhibiting the highest CAGR of 12.33%, fueled by a youthful population, rapid urbanization, and a growing middle-class consumer base.
The market is witnessing a definitive shift towards emphasis on sustainability and eco-friendly packaging, driven by increasing environmental consciousness among consumers. Ongoing innovation in product formulation is also leading, focusing on developing unique flavour profiles with natural, "clean-label" ingredients and functional additives.
In the future, The global Flavoured Water market will reach to $1,598.98 million by 2033, expanding at a compound annual growth rate of 9.7% from 2021, primarily driven by growing demand for functional ingredients and clean-label products. Ongoing innovation in natural flavourings and functional ingredients and the strong trend towards wellness-oriented products will also contribute significantly.

Anushka Gore is a Senior Research Associate at Cognitive Market Research & Consulting, specializing in the Consumer Goods sector. She is involved in delivering comprehensive market intelligence and business research solutions, utilizing both primary and secondary research methodologies to provide accurate, actionable, and data-driven insights for organizations operating across diverse consumer markets.
Her expertise includes market sizing and forecasting, competitive landscape assessment, consumer behavior analysis, brand positioning studies, customer and stakeholder surveys, expert interviews, and strategic market evaluations. Anushka works closely with manufacturers, retailers, distributors, industry experts, and consumers to gather firsthand market insights while leveraging extensive secondary research to validate market trends, demand patterns, and growth opportunities.
At Cognitive Market Research & Consulting, she contributes to market research reports, custom consulting engagements, and survey-based studies spanning various consumer goods categories, including packaged foods, beverages, personal care products, household products, consumer electronics, lifestyle products, and emerging consumer brands. Her research helps organizations understand changing consumer preferences, purchasing behaviors, distribution channel dynamics, competitive strategies, and innovation trends shaping the consumer goods industry.
Through her analytical approach and deep understanding of consumer markets, Anushka supports businesses in identifying growth opportunities, evaluating market potential, optimizing product strategies, and making informed strategic decisions. Her commitment to delivering high-quality research enables organizations to adapt to evolving consumer demands, strengthen market positioning, and achieve sustainable growth in an increasingly competitive marketplace.
Frequently Asked Questions
★ Reviews
Rate this report
Flavoured Water Market Analysis — Table of Contents
- This is just a redacted sample pages of the actual deliverable report and only for representative purposes
- Charts/Graphs/Numbers/data are only for Representative purposes and do not depict actual statistics.
- The table of Contents differs according to the user License selection. Current Displayed TOC is for the Corporate User License Report Edition. TOC Customization options: Add or Remove section/s Or chapter/s from the report.
- Specific Tables, Graphs, Sections, and Chapters can be ordered at a discounted price.
- If applicable; On Request Volume Data will also be provided (at an Additional Cost).
Report Scope
| Product Type Outlook: | Still, Sparkling |
|---|---|
| Nature Outlook: | Organic, Conventional |
| Flavor Outlook: | Original, Orange, Vanilla, Lemon, Pineapple, Grape, Peach, Fruit Punch, Apple, Berry, Raspberry, Blueberry, Strawberry, Cherry, Watermelon, Cola, Coconut, Citrus |
| Packaging Outlook: | Bottle, Can, Box, Cup, Pouch |
| Distribution Channel Outlook: | B2B, B2C, Supermarket/Hypermarket, Departmental Store, Convenience Store, Online Retail, Others |
| List of Competitors | Nestlé, Talking Rain, PepsiCo, Inc., The Coca-Cola Company, Hint, Inc., Spindrift, National Beverage Corp., Sanpellegrino S.P.A., KeurigDr Pepper, Inc., Saratoga Spring Water Company |
Chapter 1. Competitor Analysis (Subject to Data Availability (Private Players))
- 1.1 Top Competitors Analysis
- 1.1.1 Global Flavoured Water Market Analysis by Key Players
- 1.1.2 Segment Market Analysis by Key Players
- 1.1.3 Top Players Ranking 2024
- 1.1.4 New Product Launch Analysis
- 1.1.5 Industry Mergers and Acquisition Analysis
- 1.2 Company Profile (Data Subject to Availability) Sample Format
- 1.2.1 Nestlé
- 1.2.1.1 Company Basic Information, Manufacturing Base, Sales Area, and Competitors
- 1.2.1.2 Business Overview
- 1.2.1.3 Financials (Subject to data availability)
- 1.2.1.4 R&D Investment (Subject to data availability)
- 1.2.1.5 Product Types Specification
- 1.2.1.6 Business Strategy
- 1.2.1.7 Recent Developments
- 1.2.1.8 Management Change
- 1.2.1.9 S.W.O.T Analysis
- 1.2.2 Talking Rain
- 1.2.2.1 Company Basic Information, Manufacturing Base, Sales Area, and Competitors
- 1.2.2.2 Business Overview
- 1.2.2.3 Financials (Subject to data availability)
- 1.2.2.4 R&D Investment (Subject to data availability)
- 1.2.2.5 Product Types Specification
- 1.2.2.6 Business Strategy
- 1.2.2.7 Recent Developments
- 1.2.2.8 Management Change
- 1.2.2.9 S.W.O.T Analysis
- 1.2.3 PepsiCo
- 1.2.3.1 Company Basic Information, Manufacturing Base, Sales Area, and Competitors
- 1.2.3.2 Business Overview
- 1.2.3.3 Financials (Subject to data availability)
- 1.2.3.4 R&D Investment (Subject to data availability)
- 1.2.3.5 Product Types Specification
- 1.2.3.6 Business Strategy
- 1.2.3.7 Recent Developments
- 1.2.3.8 Management Change
- 1.2.3.9 S.W.O.T Analysis
- 1.2.4 Inc.
- 1.2.4.1 Company Basic Information, Manufacturing Base, Sales Area, and Competitors
- 1.2.4.2 Business Overview
- 1.2.4.3 Financials (Subject to data availability)
- 1.2.4.4 R&D Investment (Subject to data availability)
- 1.2.4.5 Product Types Specification
- 1.2.4.6 Business Strategy
- 1.2.4.7 Recent Developments
- 1.2.4.8 Management Change
- 1.2.4.9 S.W.O.T Analysis
- 1.2.5 The Coca-Cola Company
- 1.2.5.1 Company Basic Information, Manufacturing Base, Sales Area, and Competitors
- 1.2.5.2 Business Overview
- 1.2.5.3 Financials (Subject to data availability)
- 1.2.5.4 R&D Investment (Subject to data availability)
- 1.2.5.5 Product Types Specification
- 1.2.5.6 Business Strategy
- 1.2.5.7 Recent Developments
- 1.2.5.8 Management Change
- 1.2.5.9 S.W.O.T Analysis
- 1.2.6 Hint
- 1.2.6.1 Company Basic Information, Manufacturing Base, Sales Area, and Competitors
- 1.2.6.2 Business Overview
- 1.2.6.3 Financials (Subject to data availability)
- 1.2.6.4 R&D Investment (Subject to data availability)
- 1.2.6.5 Product Types Specification
- 1.2.6.6 Business Strategy
- 1.2.6.7 Recent Developments
- 1.2.6.8 Management Change
- 1.2.6.9 S.W.O.T Analysis
- 1.2.7 Inc.
- 1.2.7.1 Company Basic Information, Manufacturing Base, Sales Area, and Competitors
- 1.2.7.2 Business Overview
- 1.2.7.3 Financials (Subject to data availability)
- 1.2.7.4 R&D Investment (Subject to data availability)
- 1.2.7.5 Product Types Specification
- 1.2.7.6 Business Strategy
- 1.2.7.7 Recent Developments
- 1.2.7.8 Management Change
- 1.2.7.9 S.W.O.T Analysis
- 1.2.8 Spindrift
- 1.2.8.1 Company Basic Information, Manufacturing Base, Sales Area, and Competitors
- 1.2.8.2 Business Overview
- 1.2.8.3 Financials (Subject to data availability)
- 1.2.8.4 R&D Investment (Subject to data availability)
- 1.2.8.5 Product Types Specification
- 1.2.8.6 Business Strategy
- 1.2.8.7 Recent Developments
- 1.2.8.8 Management Change
- 1.2.8.9 S.W.O.T Analysis
- 1.2.9 National Beverage Corp.
- 1.2.9.1 Company Basic Information, Manufacturing Base, Sales Area, and Competitors
- 1.2.9.2 Business Overview
- 1.2.9.3 Financials (Subject to data availability)
- 1.2.9.4 R&D Investment (Subject to data availability)
- 1.2.9.5 Product Types Specification
- 1.2.9.6 Business Strategy
- 1.2.9.7 Recent Developments
- 1.2.9.8 Management Change
- 1.2.9.9 S.W.O.T Analysis
- 1.2.10 Sanpellegrino S.P.A.
- 1.2.10.1 Company Basic Information, Manufacturing Base, Sales Area, and Competitors
- 1.2.10.2 Business Overview
- 1.2.10.3 Financials (Subject to data availability)
- 1.2.10.4 R&D Investment (Subject to data availability)
- 1.2.10.5 Product Types Specification
- 1.2.10.6 Business Strategy
- 1.2.10.7 Recent Developments
- 1.2.10.8 Management Change
- 1.2.10.9 S.W.O.T Analysis
- 1.2.11 KeurigDr Pepper
- 1.2.11.1 Company Basic Information, Manufacturing Base, Sales Area, and Competitors
- 1.2.11.2 Business Overview
- 1.2.11.3 Financials (Subject to data availability)
- 1.2.11.4 R&D Investment (Subject to data availability)
- 1.2.11.5 Product Types Specification
- 1.2.11.6 Business Strategy
- 1.2.11.7 Recent Developments
- 1.2.11.8 Management Change
- 1.2.11.9 S.W.O.T Analysis
- 1.2.12 Inc.
- 1.2.12.1 Company Basic Information, Manufacturing Base, Sales Area, and Competitors
- 1.2.12.2 Business Overview
- 1.2.12.3 Financials (Subject to data availability)
- 1.2.12.4 R&D Investment (Subject to data availability)
- 1.2.12.5 Product Types Specification
- 1.2.12.6 Business Strategy
- 1.2.12.7 Recent Developments
- 1.2.12.8 Management Change
- 1.2.12.9 S.W.O.T Analysis
- 1.2.13 Saratoga Spring Water Company
- 1.2.13.1 Company Basic Information, Manufacturing Base, Sales Area, and Competitors
- 1.2.13.2 Business Overview
- 1.2.13.3 Financials (Subject to data availability)
- 1.2.13.4 R&D Investment (Subject to data availability)
- 1.2.13.5 Product Types Specification
- 1.2.13.6 Business Strategy
- 1.2.13.7 Recent Developments
- 1.2.13.8 Management Change
- 1.2.13.9 S.W.O.T Analysis
- 1.2.1 Nestlé
- 1.1 Top Competitors Analysis
Chapter 2. Global Flavoured Water Market Analysis
- 2.1 Global Flavoured Water Market Analysis
- 2.2 Global Flavoured Water Market Analysis by Region
- 2.3 Global Flavoured Water Market Analysis by Product Type Outlook:
- 2.4 Global Flavoured Water Market Analysis by Nature Outlook:
- 2.5 Global Flavoured Water Market Analysis by Flavor Outlook:
- 2.6 Global Flavoured Water Market Analysis by Packaging Outlook:
- 2.7 Global Flavoured Water Market Analysis by Distribution Channel Outlook:
- 2.8 Global Flavoured Water Market Analysis by Key Players
Chapter 3. North America Flavoured Water Market Analysis
- 3.1 North America Flavoured Water Market Analysis
- 3.2 North America Flavoured Water Market Analysis by Country
- 3.3 North America Flavoured Water Market Analysis by Product Type Outlook:
- 3.4 North America Flavoured Water Market Analysis by Nature Outlook:
- 3.5 North America Flavoured Water Market Analysis by Flavor Outlook:
- 3.6 North America Flavoured Water Market Analysis by Packaging Outlook:
- 3.7 North America Flavoured Water Market Analysis by Distribution Channel Outlook:
- 3.8 North America Flavoured Water Market Analysis by Key Players
Chapter 4. Europe Flavoured Water Market Analysis
- 4.1 Europe Flavoured Water Market Analysis
- 4.2 Europe Flavoured Water Market Analysis by Country
- 4.3 Europe Flavoured Water Market Analysis by Product Type Outlook:
- 4.4 Europe Flavoured Water Market Analysis by Nature Outlook:
- 4.5 Europe Flavoured Water Market Analysis by Flavor Outlook:
- 4.6 Europe Flavoured Water Market Analysis by Packaging Outlook:
- 4.7 Europe Flavoured Water Market Analysis by Distribution Channel Outlook:
- 4.8 Europe Flavoured Water Market Analysis by Key Players
Chapter 5. Asia Pacific Flavoured Water Market Analysis
- 5.1 Asia Pacific Flavoured Water Market Analysis
- 5.2 Asia Pacific Flavoured Water Market Analysis by Country
- 5.3 Asia Pacific Flavoured Water Market Analysis by Product Type Outlook:
- 5.4 Asia Pacific Flavoured Water Market Analysis by Nature Outlook:
- 5.5 Asia Pacific Flavoured Water Market Analysis by Flavor Outlook:
- 5.6 Asia Pacific Flavoured Water Market Analysis by Packaging Outlook:
- 5.7 Asia Pacific Flavoured Water Market Analysis by Distribution Channel Outlook:
- 5.8 Asia Pacific Flavoured Water Market Analysis by Key Players
Chapter 6. South America Flavoured Water Market Analysis
- 6.1 South America Flavoured Water Market Analysis
- 6.2 South America Flavoured Water Market Analysis by Country
- 6.3 South America Flavoured Water Market Analysis by Product Type Outlook:
- 6.4 South America Flavoured Water Market Analysis by Nature Outlook:
- 6.5 South America Flavoured Water Market Analysis by Flavor Outlook:
- 6.6 South America Flavoured Water Market Analysis by Packaging Outlook:
- 6.7 South America Flavoured Water Market Analysis by Distribution Channel Outlook:
- 6.8 South America Flavoured Water Market Analysis by Key Players
Chapter 7. Middle East Flavoured Water Market Analysis
- 7.1 Middle East Flavoured Water Market Analysis
- 7.2 Middle East Flavoured Water Market Analysis by Country
- 7.3 Middle East Flavoured Water Market Analysis by Product Type Outlook:
- 7.4 Middle East Flavoured Water Market Analysis by Nature Outlook:
- 7.5 Middle East Flavoured Water Market Analysis by Flavor Outlook:
- 7.6 Middle East Flavoured Water Market Analysis by Packaging Outlook:
- 7.7 Middle East Flavoured Water Market Analysis by Distribution Channel Outlook:
- 7.8 Middle East Flavoured Water Market Analysis by Key Players
Chapter 8. Africa Flavoured Water Market Analysis
- 8.1 Africa Flavoured Water Market Analysis
- 8.2 Africa Flavoured Water Market Analysis by Country
- 8.3 Africa Flavoured Water Market Analysis by Product Type Outlook:
- 8.4 Africa Flavoured Water Market Analysis by Nature Outlook:
- 8.5 Africa Flavoured Water Market Analysis by Flavor Outlook:
- 8.6 Africa Flavoured Water Market Analysis by Packaging Outlook:
- 8.7 Africa Flavoured Water Market Analysis by Distribution Channel Outlook:
- 8.8 Africa Flavoured Water Market Analysis by Key Players
Chapter 9. Product Type Outlook: Analysis
- 9.1 Still
- 9.1.1 Global Still Market
- 9.1.2 Global Still Market by Region
- 9.2 Sparkling
- 9.2.1 Global Sparkling Market
- 9.2.2 Global Sparkling Market by Region
- 9.1 Still
Chapter 10. Nature Outlook: Analysis
- 10.1 Organic
- 10.1.1 Global Organic Market
- 10.1.2 Global Organic Market by Region
- 10.2 Conventional
- 10.2.1 Global Conventional Market
- 10.2.2 Global Conventional Market by Region
- 10.1 Organic
Chapter 11. Flavor Outlook: Analysis
- 11.1 Original
- 11.1.1 Global Original Market
- 11.1.2 Global Original Market by Region
- 11.2 Orange
- 11.2.1 Global Orange Market
- 11.2.2 Global Orange Market by Region
- 11.3 Vanilla
- 11.3.1 Global Vanilla Market
- 11.3.2 Global Vanilla Market by Region
- 11.4 Lemon
- 11.4.1 Global Lemon Market
- 11.4.2 Global Lemon Market by Region
- 11.5 Pineapple
- 11.5.1 Global Pineapple Market
- 11.5.2 Global Pineapple Market by Region
- 11.6 Grape
- 11.6.1 Global Grape Market
- 11.6.2 Global Grape Market by Region
- 11.7 Peach
- 11.7.1 Global Peach Market
- 11.7.2 Global Peach Market by Region
- 11.8 Fruit Punch
- 11.8.1 Global Fruit Punch Market
- 11.8.2 Global Fruit Punch Market by Region
- 11.9 Apple
- 11.9.1 Global Apple Market
- 11.9.2 Global Apple Market by Region
- 11.10 Berry
- 11.10.1 Global Berry Market
- 11.10.2 Global Berry Market by Region
- 11.11 Raspberry
- 11.11.1 Global Raspberry Market
- 11.11.2 Global Raspberry Market by Region
- 11.12 Blueberry
- 11.12.1 Global Blueberry Market
- 11.12.2 Global Blueberry Market by Region
- 11.13 Strawberry
- 11.13.1 Global Strawberry Market
- 11.13.2 Global Strawberry Market by Region
- 11.14 Cherry
- 11.14.1 Global Cherry Market
- 11.14.2 Global Cherry Market by Region
- 11.15 Watermelon
- 11.15.1 Global Watermelon Market
- 11.15.2 Global Watermelon Market by Region
- 11.16 Cola
- 11.16.1 Global Cola Market
- 11.16.2 Global Cola Market by Region
- 11.17 Coconut
- 11.17.1 Global Coconut Market
- 11.17.2 Global Coconut Market by Region
- 11.18 Citrus
- 11.18.1 Global Citrus Market
- 11.18.2 Global Citrus Market by Region
- 11.1 Original
Chapter 12. Packaging Outlook: Analysis
- 12.1 Bottle
- 12.1.1 Global Bottle Market
- 12.1.2 Global Bottle Market by Region
- 12.2 Can
- 12.2.1 Global Can Market
- 12.2.2 Global Can Market by Region
- 12.3 Box
- 12.3.1 Global Box Market
- 12.3.2 Global Box Market by Region
- 12.4 Cup
- 12.4.1 Global Cup Market
- 12.4.2 Global Cup Market by Region
- 12.5 Pouch
- 12.5.1 Global Pouch Market
- 12.5.2 Global Pouch Market by Region
- 12.1 Bottle
Chapter 13. Distribution Channel Outlook: Analysis
- 13.1 B2B
- 13.1.1 Global B2B Market
- 13.1.2 Global B2B Market by Region
- 13.2 B2C
- 13.2.1 Global B2C Market
- 13.2.2 Global B2C Market by Region
- 13.3 Supermarket/Hypermarket
- 13.3.1 Global Supermarket/Hypermarket Market
- 13.3.2 Global Supermarket/Hypermarket Market by Region
- 13.4 Departmental Store
- 13.4.1 Global Departmental Store Market
- 13.4.2 Global Departmental Store Market by Region
- 13.5 Convenience Store
- 13.5.1 Global Convenience Store Market
- 13.5.2 Global Convenience Store Market by Region
- 13.6 Online Retail
- 13.6.1 Global Online Retail Market
- 13.6.2 Global Online Retail Market by Region
- 13.7 Others
- 13.7.1 Global Others Market
- 13.7.2 Global Others Market by Region
- 13.1 B2B
Chapter 14. Qualitative Analysis (Subject to Data Availability)
- 14.1 Market Drivers
- 14.2 Market Restraints
- 14.3 Market Trends
- 14.4 Market Opportunity
- 14.5 Technological Road Map (Subject to Data Availability)
- 14.6 Product Life Cycle (Subject to Data Availability)
- 14.7 Customer and Buyer Behavior Analysis
- 14.7.1 Digital Engagement, Customer Experience & Relationship Analysis
- 14.7.2 Customer Buying Behavior & Purchase Decision Analysis
- 14.7.3 Vendor Selection, Supplier Preferences & Future Demand Trends
- 14.7.4 Pricing, Affordability & Value Perception Analysis
- 14.7.5 Customer Segmentation & Demand Pattern Analysis
- 14.8 PESTEL Analysis
- 14.8.1 Political Factors
- 14.8.2 Economic Factors
- 14.8.3 Social Factors
- 14.8.4 Technological Factors
- 14.8.5 Legal Factors
- 14.8.6 Environmental Factors
- 14.9 Industrial Chain Analysis (Subject to Data Availability)
- 14.9.1 Industry Chain Analysis
- 14.9.2 Manufacturing Cost Analysis
- 14.9.3 Supply Side Analysis
- 14.9.3.1 Raw Material Analysis
- 14.9.3.2 Raw Material Procurement Analysis
- 14.9.3.3 Raw Material Price Trend Analysis
- 14.10 Porter’s Five Forces Analysis
- 14.10.1 Bargaining Power of Suppliers
- 14.10.2 Bargaining Power of Buyers
- 14.10.3 Threat of New Entrants
- 14.10.4 Threat of Substitutes
- 14.10.5 Degree of Competition
- 14.11 Patent Analysis (Subject to Data Availability)
- 14.12 ESG Analysis
- 14.13 Geopolitical Outlook
- 14.13.1 Global Power Realignment & Strategic Alliances
- 14.13.2 Geopolitical Risk Landscape & Conflict Hotspots
- 14.13.3 International Trade Relations & Market Access Environment
- 14.13.4 Regulatory & Policy Shifts Impacting Cross-Border Operations
- 14.13.5 Supply Chain Resilience, Localization & Resource Nationalism
- 14.13.6 Technology Sovereignty & Digital Geopolitics
- 14.13.7 Strategic Implications for Investment, Growth & Market Entry
- 14.14 AI & Market Transformation
- 14.14.1 Competitive Landscape Disruption & Strategic Shifts
- 14.14.2 AI-Driven Transformation of Industry Value Chain
- 14.14.3 Evolution of Business Models & Revenue Streams
- 14.14.4 AI-Driven Product, Service & Innovation Transformation
- 14.14.5 Customer Behavior, AI Adoption & Future Market Evolution
Chapter 15. TOP 10 Country Analysis
- 15.1 Country 1
- 15.2 Country 2
- 15.3 Country 3
- 15.4 Country 4
- 15.5 Country 5
- 15.6 Country 6
- 15.7 Country 7
- 15.8 Country 8
- 15.9 Country 9
- 15.10 Country 10
Chapter 16. Research Findings
- 16.1 Key Takeaways
- 16.2 Analyst Point of View
- 16.3 Assumptions and Acronyms
Chapter 17. Research Methodology and Sources
- 17.1 Primary Data Collection
- 17.1.1 Steps for Primary Data Collection
- 17.1.1.1 Identification of KOL
- 17.1.2 Backward Integration
- 17.1.3 Forward Integration
- 17.1.4 How Primary Research Help Us
- 17.1.5 Modes of Primary Research
- 17.1.1 Steps for Primary Data Collection
- 17.2 Secondary Research
- 17.2.1 How Secondary Research Help Us
- 17.2.2 Sources of Secondary Research
- 17.3 Data Validation
- 17.3.1 Data Triangulation
- 17.4 Data Representation
- 17.1 Primary Data Collection
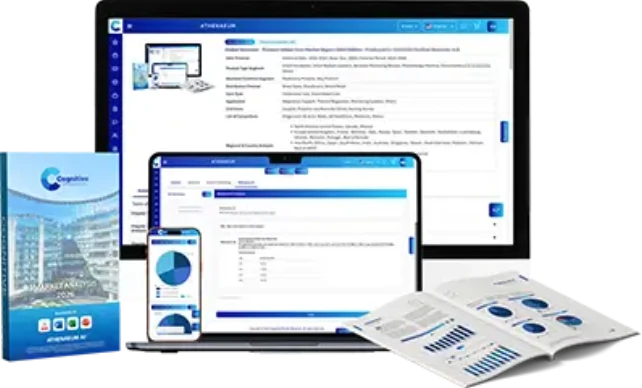
Athenaeum AI Dashboard
Our Proprietary Methodology
Cognitive Market Research and Consulting "The Full Truth" methodology — a rigorous triangulation process that combines primary research, secondary validation, and expert calibration. Implemented by Anushka Gore and team for the Flavoured Water Market Analysis Market analysis.
Primary Intelligence Gathering
Direct interviews with 50+ industry stakeholders including manufacturers, distributors, end-users, and regulatory bodies across all six regions.
Secondary Data Triangulation
Cross-referencing against trade databases, customs records, financial filings, patent databases, and verified industry publications.
Expert Validation Protocol
Each data point undergoes validation by minimum two independent domain experts with 15+ years of industry experience.
Athenaeum AI Processing
Our proprietary AI platform aggregates, normalizes, and identifies patterns across 10,000+ data points to surface non-obvious insights.
Editorial & QA Review
Final review by senior analysts ensures accuracy, coherence, and actionability of all insights and recommendations.
Data Assurance Metrics
Analytical Coverage
To maintain the integrity of our proprietary methodology and protect our elite expert network, specific source disclosures are reserved for full-access partners. Our research framework is anchored by a 70:30 primary-to-secondary ratio, ensuring your strategy is driven by real-time market intelligence rather than recycled, publicly available, or AI-generated data. Every deliverable includes an exhaustive source directory and grants direct analyst access.
Sources from the Consumer Industry
The Three Pillars of End-to-End Market Research Services
We don't just hand over data. We partner with your team across three integrated service lines — each designed to give you decision-grade intelligence on the Flavoured Water Market Analysis market.
Market Survey
Structured primary research across both B2B and B2C channels. We design and execute custom surveys targeting manufacturers, distributors, procurement heads, and end-consumers in the flavoured water market analysis ecosystem — validated by our global panel of 10,000+ industrial respondents.
- Buyer intent & sentiment analysis
- Purchase cycle mapping
- Price sensitivity research
- Channel preference profiling
- Competitive perception study
Customized Market Data & Reports
Choose from our ready-to-access 8th Edition report or commission a fully customized dataset tailored to your exact strategic questions. Cross-splits, custom geographies, proprietary segmentation — we build the intelligence asset your board actually needs.
- Ready syndicate report
- Custom data scope & segmentation
- Excel quantitative models
- Board-ready PPT with key findings
- Secure cloud portal access
Strategic Consultation
Every survey and every report comes with dedicated analyst consultation. Our senior research team walks your leadership through findings, answers strategic questions in real-time, and helps translate data into your next board presentation or investment thesis.
- Dedicated analyst assigned to you
- Live walkthrough of findings
- Strategic Q&A sessions
- Go-to-market recommendations
- NDA-protected engagement
Customize This Report
Tell us the specific segments, regions, or companies you need — and we will tailor the deliverable to your requirements.