
Electric Vehicle Market Analysis from 2022 to 2034 Containing Market Size, Share along with its CAGR, Forecast and Trends
Top Countries — Revenue
Billion
Loading…
Market Dynamics of Electric Vehicle Market Analysis
↑ Growth Drivers
Government Policies & Emission Regulations
Global governments are enforcing stringent emission standards and providing strong policy support to drive EV adoption.
For example, the EU plans to ban sales of new internal combustion engine (ICE) vehicles by 2035, and India's FAME II scheme is offering incentives for electric 2-wheelers, 3-wheelers, and buses.
Market Opportunity: Growth in EV Charging Infrastructure & Energy Storage Integration
The expansion of charging infrastructure is unlocking EV market potential in underserved regions.
For instance, China has over 2.7 million public chargers (as of 2024), the largest in the world, and aims to double it by 2025. Integration of EVs with renewable-powered charging stations and V2G (vehicle-to-grid) systems is gaining traction. This infrastructure-led growth is a huge opportunity for energy companies, startups, and utilities investing in grid-tied EV ecosystems.
↓ Restraints
- High Upfront Costs
- Inadequate Charging Infrastructure
- Battery Lifecycle and Recycling Issues
~ Trends
Electrification of Commercial Fleets & Shared Mobility
Major logistics and ride-hailing companies are transitioning to electric fleets to cut operational costs and meet ESG goals. Urban last-mile delivery services are increasingly shifting to electric 2-wheelers and 3-wheelers in Southeast Asia and Europe. Amazon aims to deploy 100,000 Rivian electric delivery vans by 2030, and Uber has committed to go fully electric in key cities by 2030.
Access the full forecast model.
Country-level data · Company profiles · Editable dataset · Analyst consultation included.
Electric Vehicle Market Analysis — Presence
Interactive World Map
Click countries to explore Loading map…
Regional and Country Analysis
- North America — United States, Canada, Mexico
- Europe — United Kingdom, France, Germany, Italy, Russia, Spain, Sweden, Denmark, Switzerland, Luxembourg, Rest of Europe
- Asia Pacific — China, Japan, South Korea, India, Australia, Singapore, Taiwan, South East Asia, Rest of APAC
- South America — Brazil, Argentina, Colombia, Peru, Chile, Rest of South America
- Middle East — Saudi Arabia, Turkey, UAE, Egypt, Qatar, Rest of Middle East
- Africa — East Africa, West Africa, North Africa, South Africa
| Region / Country | 2021 (A) | 2025 (A) | 2033 (P) | CAGR |
|---|
A = Actual · E = Estimated · P = Projected · 🔒 Locked values require full access. Click headers to sort.
Unlock full regional dataset →Segmentation Analysis
Technological Advancement
The EV sector is rapidly transforming technologically in almost every area of battery chemistry, motor drive efficiency, charging systems, and connectivity. For example, solid-state batteries have been developed that promise higher energy density, faster charging, and better safety; companies such as Toyota and QuantumScape are actively prototyping this technology with aspirations to mass produce solid-state batteries by 2027. Silicon anode batteries (proprietary to firms such as Sila Nanotechnologies and Mercedes-Benz) are also being developed, and they promise at least a 20% increase in range over traditional lithium-ion packs.
Ultra-fast charging networks, such as IONITY in Europe, have now produced charging stations, such as Tesla Superchargers, that can charge an EV to 80% of its full capacity in approximately twenty minutes. Even more exciting is the rise of wireless EV charging systems for public and private use; companies such as WiTricity and HEVO are piloting inductive charging-based systems. There have also been advancements in thermal management systems, and artificial intelligence (AI) based battery management systems (BMS) that ensure battery life, energy efficiency, and safety; this is especially beneficial for high-performance EVs, such as the Lucid Air and Tesla Model S Plaid.V2G innovative technology allows EVs to put energy back into the grid. Nissan's Leaf and Ford's F-150 Lightning are early instances of V2G-powered cars, helping manage peak demand and increase grid resource stability.
Investment and Funding
|
Year |
News |
|
March 2025 |
|
|
November 2023 |
|
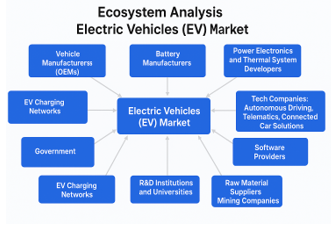
Ecosystem Analysis
The Electric Vehicles (EV) Market has a multi-faceted, dynamic ecosystem that encompasses multiple industries and stakeholders. At the center of the ecosystem are vehicle OEMs like Tesla, BYD, Hyundai, and Volkswagen that design and assemble the electric cars, bikes, buses and trucks; surrounded by battery manufacturers like CATL, LG Energy Solution and Panasonic that provide the lithium ion or solid-state power sources. In addition to this are battery management system (BMS) companies, developers of power electronics and thermal systems to assist with safety and efficiency. On the infrastructure side, companies like ChargePoint, ABB, and Ionity are building their EV charging networks, and energy utilities and grid operators are integrating vehicle-to-grid (V2G) capacity with the electric power grid to stabilize the electric power demand caused by EV charging.
Upstream in the value chain are the raw material suppliers (for lithium, cobalt, nickel, and graphite) and mining companies that will be impacted by geopolitical state shifts to the cost and availability of critical minerals. Governments act as a powerful enabler through regulation, subsidies, and emission mandates; along with research and development (R&D) institutions and universities that drive innovation around materials and mobility systems. Interestingly, tech companies like Google, Apple, and Nvidia are all in development of autonomous driving, telematics, and connected car solutions that make EVs more intelligent and responsive.
This interdependent ecosystem also includes software providers, fleet operators, aftermarket service networks, and financial institutions offering EV leasing or insurance. Together, this ecosystem ensures that EVs are not just cars, but integral components of a smarter, greener, and digitally connected mobility future.
List of Manufacturers:

List of Distributors:

List of Raw Material Suppliers

Patent Analysis:
Patent analysis in this sector reveals key trends in innovation, competitive positioning, and technology focus areas.
|
SR NO |
Patent Name |
Patent No. |
Description
|
Filed Date |
Expiry Date |
|
1. |
Electric Car
|
CN111376742A
|
The application filed by Toyota Motor Corp. The electric vehicle includes a power converter that converts the electric power of the main battery into the driving electric power of the electric motor for running. |
2019-12-26 |
Pending |
|
2. |
Electric automobile and high-voltage electric integrated system
|
CN218085085U
|
The application filed by Weilai Automobile Technology Anhui Co Ltd. The utility model relates to an electric automobile technical field specifically provides an electric automobile and high-voltage electrical integrated system. |
2022-08-30 |
2032-08-30 |
Recent Developments:
| Year | News |
|---|---|
| On 24 January 2025 | • Tesla has released the new Model Y in the US and Canada. The US pricing for the Model Y Launch Series, which begins at USD 59,990 before options, began deliveries in March 2025 |
| July 2022 | • Tesla has released the new Model Y in the US and Canada. The US pricing for the Model Y Launch Series, which begins at USD 59,990 before options, began deliveries in March 2025 |
Trade Analysis
The global trade environment for electric vehicles is rapidly changing due to shifting supply chains, critical mineral dependencies, and protectionist measures. The global competition is growing among major EV producing nations (China, Germany, South Korea, the U.S., etc.) in part because of the new trade issues (tariffs, localization requirements) that are also affecting global trade. China is still the number one exporter of electric vehicles (EVs) in the world, especially to Europe, where cheap EVs from BYD and SAIC are competing in the marketplace.
The EU is now exploring possible anti-subsidy tariffs on Chinese EVs in order to safeguard its domestic EV manufacturers. The trade issue between the U.S. and China, along with the Inflation Reduction Act (IRA) creating more rigid sourcing structures of battery materials, has compelled further nearshoring and shifting of minerals for battery materials to allied countries like Canada, Mexico, and Australia. South Korea and Japan still remain primary exporters of advanced EV components like battery cells, inverters, and semiconductors. Meanwhile, nations with lithium, cobalt, and nickel deposits (Chile, Indonesia, Democratic Republic of Congo) are now vital in helping countries obtain upstream battery supply to build EVs. As nations trade policy evolves into a strategic and security-based environment, all automakers are now also investing more into domestic factories and diversifying the sourcing of minerals to lessen geopolitical risks and reliance on specific countries.
Conferences and Events:
|
Sr. No |
Event Name |
Location |
Description |
|---|---|---|---|
|
1. |
EVS – Electric Vehicle Symposium & Exhibition |
Globally |
One of the largest global platforms for electric mobility, covering EV tech, battery systems, and future mobility. |
|
2. |
Battery Electric Vehicle (BEV) Congress |
U.S. |
Battery advancements, grid integration, charging infrastructure, and EV architecture. |
|
3. |
MOVE: Mobility Re-Imagined |
London, UK & Asia editions |
Startups, OEMs, and government agencies discuss scale-up strategies and policy frameworks. |
|
4. |
Auto Expo – The Motor Show |
India |
Platform where Tata Motors, MG, and others launch new EV models for Asian markets. |
|
5. |
International Conference on Electric Vehicle and Battery Technology |
U.S., Canada, and EU countries. |
Useful for tracking patent discussions, battery chemistry evolution, and EV safety testing standards. |
Inorganic Strategies
|
Year |
News |
|
February 2023 |
|
|
March 2023 |
|
Regulatory Landscape:
The regulatory environment for electric vehicles is evolving rapidly, driven by global climate goals, air quality standards, and energy transition efforts.
Emission Reduction & Phase-Out Mandates: The EU’s Fit for 55 package mandates a 100% reduction in CO? emissions from new cars by 2035, effectively banning the sale of new petrol and diesel vehicles.
EV Purchase Incentives & Subsidies: India (FAME II): The Faster Adoption and Manufacturing of Electric Vehicles scheme offers direct subsidies for EVs and charging infrastructure.
Battery & Safety Regulations: UN ECE R100/R136: Sets global standards for battery safety, thermal management, and electrical protection.
EU Battery Regulation (2023): Introduces strict traceability, carbon footprint labeling, and recycling obligations for batteries used in EVs.
Vehicle-to-Grid (V2G) and Smart Charging Policies: Countries like Germany, Japan, and the Netherlands are piloting V2G integration, supported by flexible grid codes and incentives.
Analyst Recommendation:
Evolving electric vehicle landscape, it is evident that the global EV market is transitioning from early adoption to mainstream penetration, spurred by policy reforms, technological advancements, and consumer awareness. To remain competitive in this environment, stakeholders must adopt a holistic approach that spans beyond vehicle production and embraces localized supply chains, battery innovation, charging infrastructure, and regulatory compliance. Given the increasing scrutiny around sourcing, environmental impact, and product lifecycle, it is recommended that companies adopt a vertically integrated model and invest in both digital and sustainable solutions. The market also presents strong opportunities in the mid-priced EV segment, battery recycling, and fleet electrification, especially in emerging economies where regulatory frameworks are beginning to align with global trends.
Key Recommendations:
Localize Supply Chains to Mitigate Trade Risks
- Establish regional manufacturing hubs for batteries and components to meet tariff and incentive requirements
Invest in Battery Lifecycle Innovation
- Prioritize R&D in solid-state and sodium-ion battery technologies to enhance range, safety, and cost.
Expand Charging Infrastructure Collaborations
- Partner with utility companies and municipalities to develop ultra-fast and accessible EV charging networks.
Capitalize on Fleet Electrification & B2B Segments
- Focus on commercial fleets, last-mile delivery, and urban transit systems where electrification demand is rising.
Leverage Government Incentives and Public-Private Partnerships
- Align product portfolios with national and regional subsidy programs.
Market size by (Illustrative, 2025)
Share distribution (2025)
Charts are illustrative — exact values, country-level breakdowns, and full forecast in the paid report. Request a Free Sample PDF.
To learn more about market share and segmentation, request the free sample pages.
Competitive Landscape
Leading Companies:
- BYD
- Tesla
- Hyundai Motor Group
- General Motors
- Volkswagen
- Renault
Emerging Players
- Rivian Automotive
- Lucid Motors
- XPeng Motors
- VinFast
Leading players in the EV market are characterized by their global manufacturing scale, advanced R&D in battery and autonomous technologies, and strong distribution networks. These companies have well-established brand equity, enabling them to dominate in both mature and emerging markets. Their ability to align with evolving regulations and invest in sustainable practices gives them a long-term competitive edge.
Emerging players are reshaping the EV landscape by targeting niche segments, offering affordable and innovative models, and leveraging digital-first strategies. They often operate with leaner, more flexible business models and are backed by strategic investments or government incentives. Their agility allows them to respond quickly to market demands and explore untapped growth opportunities.
Click any bar or cell to request the full company profile
| Company | 2022 (A) | 2023 (A) | 2024 (A) | 2025 (A) |
|---|---|---|---|---|
| BYD | ••• | ••• | ••• | ••• |
| Tesla | ••• | ••• | ••• | ••• |
| Hyundai Motor Group | ••• | ••• | ••• | ••• |
| General Motors | ••• | ••• | ••• | ••• |
| Volkswagen | ••• | ••• | ••• | ••• |
| Renault | ••• | ••• | ••• | ••• |
Revenue data requires full access. *2nd & 3rd tier companies available on enquiry.
Request company profile for validation →Report Scope & Analysis
Executive Summary of Electric Vehicle Market
The global Electric Vehicle (EV) market is undergoing a monumental transformation, driven by a confluence of stringent environmental regulations, significant government incentives, and rapid technological advancements in battery technology and charging infrastructure. The market is projected to experience robust growth, expanding from approximately $489.94 billion in 2021 to an estimated $2,487.75 billion by 2033, reflecting an impressive Compound Annual Growth Rate (CAGR) of 14.5%. This expansion is not uniform, with the Asia-Pacific region, led by China, dominating market share and growth. As consumer awareness regarding climate change rises and the total cost of ownership for EVs becomes more competitive with internal combustion engine (ICE) vehicles, the transition to electric mobility is accelerating globally. Key challenges, including the high initial cost, range anxiety, and the need for a more extensive charging network, remain, but are being actively addressed by both public and private sector initiatives, paving the way for a mainstream EV adoption.
Key strategic insights from our comprehensive analysis reveal:
- The Asia-Pacific region stands as the powerhouse of the global EV market, commanding the largest market share, driven primarily by massive government support, manufacturing capabilities, and consumer demand in China.
- Government policies, including direct subsidies, tax credits, and stringent emission standards, are the single most significant driver of EV adoption rates across all major regions, creating a direct correlation between regulatory support and market growth.
- Technological innovation in battery systems—focusing on increased energy density, faster charging speeds, and lower costs—along with the strategic build-out of public charging infrastructure, are the primary enablers for overcoming key market restraints like range anxiety and high purchase prices.
Global Market Overview & Dynamics of Electric Vehicle Market Analysis
The global electric vehicle market is in a phase of dynamic and accelerated growth, marking a pivotal shift in the automotive industry away from fossil fuels. This transition is underpinned by a global consensus on reducing carbon emissions and is propelled by continuous innovation. The market dynamics are characterized by intense competition, with established automakers electrifying their fleets and new, EV-focused players capturing significant market share. While growth is strong, the market's trajectory is heavily influenced by regional policies, economic conditions, and the pace of infrastructure development, creating a complex and evolving global landscape.
Global Electric Vehicle Market Drivers
-
Government Policies and Financial Incentives: Governments worldwide are implementing policies such as tax credits, subsidies, and grants for purchasing EVs. Additionally, regulations mandating zero-emission vehicles and phasing out ICE vehicles are compelling both consumers and manufacturers to shift towards electric mobility.
-
Growing Environmental Concerns: Increasing public awareness and concern about air pollution and climate change are major catalysts. Consumers are increasingly choosing EVs as a cleaner, more sustainable transportation alternative, a trend reinforced by corporate sustainability goals and international climate agreements.
-
Advancements in Battery Technology and Cost Reduction: Continuous improvements in lithium-ion battery technology have led to higher energy density, longer driving ranges, and faster charging times. Simultaneously, economies of scale in battery production are driving down costs, making EVs more affordable and competitive with traditional vehicles.
Global Electric Vehicle Market Trends
-
Expansion of Charging Infrastructure: A significant trend is the rapid expansion of public and private charging networks. Investments are pouring into the development of high-speed DC fast chargers along highways and more accessible Level 2 chargers in urban and residential areas to alleviate range anxiety.
-
Diversification of EV Models: Manufacturers are expanding their EV portfolios beyond niche models to include a wide range of vehicle types, such as SUVs, pickup trucks, and commercial vans. This diversification is crucial for appealing to a broader consumer base and meeting various market needs.
-
Integration of Smart and Autonomous Technologies: EVs are increasingly becoming platforms for advanced technology, including sophisticated infotainment systems, over-the-air updates, and advanced driver-assistance systems (ADAS). The push towards fully autonomous driving capabilities is a prominent trend, with EVs often serving as the flagship models for these innovations.
Global Electric Vehicle Market Restraints
-
High Initial Purchase Price: Despite falling battery costs, the upfront cost of an EV often remains higher than that of a comparable ICE vehicle. This price disparity is a significant barrier for many potential buyers, particularly in price-sensitive and emerging markets.
-
Inadequate Charging Infrastructure and Range Anxiety: While expanding, the charging infrastructure in many regions is still insufficient to support mass adoption. This "range anxiety"—the fear of a battery running out before reaching a charging station—remains a major psychological barrier for consumers.
-
Battery Raw Material Supply Chain and Lifecycle Concerns: The supply chain for critical battery minerals like lithium, cobalt, and nickel is concentrated in a few geographic regions, creating risks of price volatility and geopolitical disruptions. Furthermore, concerns about the environmental impact of mining and the challenge of battery recycling and disposal present long-term restraints.
Strategic Recommendations for Manufacturers
To capitalize on the burgeoning EV market, manufacturers should prioritize a multi-pronged strategy. Firstly, accelerate investment in battery research and development, focusing on next-generation technologies like solid-state batteries to enhance range, reduce costs, and minimize reliance on contentious raw materials. Secondly, diversify product portfolios to include more affordable, mass-market models to penetrate emerging economies and appeal to a wider demographic. Thirdly, forge strategic partnerships with utility companies, real estate developers, and governments to co-develop and expand charging infrastructure, creating a seamless ecosystem for EV owners. Finally, enhancing software and connectivity features will be key differentiators, offering value through over-the-air updates, subscription services, and superior user experiences.
Detailed Regional Analysis: Data & Dynamics of Electric Vehicle Market Analysis
The global adoption of electric vehicles varies significantly by region, influenced by local economic conditions, government policies, and consumer preferences. The Asia-Pacific region currently leads the market, driven by China's aggressive EV strategy, while Europe follows closely due to its stringent environmental regulations. North America is also a key market with substantial growth potential, whereas South America, Africa, and the Middle East represent emerging markets at earlier stages of adoption.
North America Electric Vehicle Market Analysis
Market Size: $89.169 Billion (2021) -> $154.104 Billion (2025) -> $460.235 Billion (2033)
CAGR (2021-2033): 14.656%
Country-Specific Insight: North America will hold an 18.3% share of the global EV market in 2025. The United States is the dominant force, projected to account for 12.13% of the global market by 2025. Canada and Mexico are also experiencing strong growth, holding approximately 3.62% and 2.54% of the global market share in 2025, respectively.
Regional Dynamics:
Drivers
- Strong federal and state-level incentives, particularly the Inflation Reduction Act (IRA) in the U.S., which provides significant tax credits for EV purchases.
- High consumer interest in technology and performance, with a growing demand for electric SUVs and pickup trucks.
- Major investments by domestic automakers (GM, Ford, Tesla) to onshore production and build out supply chains.
Trends
- Rapid build-out of DC fast-charging corridors along major highways to facilitate long-distance travel.
- The "electrification" of iconic American vehicle segments, especially pickup trucks, is a major market trend.
- Increasing partnerships between automakers and utility companies for smart charging and vehicle-to-grid (V2G) programs.
Restraints
- Vast geographical distances and less-dense charging infrastructure in rural and central regions create significant range anxiety.
- Political polarization can lead to uncertainty in long-term environmental policy and incentive structures.
- Grid capacity and modernization challenges in accommodating a massive increase in electricity demand from EVs.
Technology Focus
The region's technology focus is on high-performance batteries for long-range vehicles, the development of robust ADAS and autonomous driving features, and software-defined vehicle platforms. There is a strong emphasis on large-format vehicles like SUVs and pickup trucks, requiring powerful drivetrain and battery systems.
Europe Electric Vehicle Market Analysis
Market Size: $118.075 Billion (2021) -> $198.736 Billion (2025) -> $562.233 Billion (2033)
CAGR (2021-2033): 13.882%
Country-Specific Insight: Europe is a leading region, projected to capture 23.6% of the global market in 2025. Germany leads the continent, holding 5.71% of the global market share in 2025, followed by the United Kingdom with 3.71% and France with 2.71%. Countries like Denmark and Spain are also showing impressive growth.
Regional Dynamics:
Drivers
- Extremely stringent EU-wide CO2 emission standards for new cars, imposing heavy fines on non-compliant automakers.
- Generous government subsidies and tax exemptions in countries like Germany, France, and Norway.
- Strong public environmental awareness and a well-developed public transport system that complements EV usage.
Trends
- Focus on building a dense, interoperable public charging network across the continent.
- Rising popularity of compact and mid-size EVs well-suited for European cities.
- Corporate fleets are rapidly transitioning to EVs to meet sustainability targets and benefit from tax advantages.
Restraints
- High electricity prices in several European countries can impact the total cost of ownership advantage.
- Complexities in harmonizing charging payment and access systems across different countries and providers.
- Dependence on imported batteries and raw materials, primarily from Asia.
Technology Focus
European technology efforts are geared towards high-efficiency powertrains to comply with strict regulations, development of a comprehensive charging standard (CCS), and circular economy initiatives, including battery recycling and second-life applications, driven by EU directives.
Asia Pacific (APAC) Electric Vehicle Market Analysis
Market Size: $203.325 Billion (2021) -> $357.893 Billion (2025) -> $1107.05 Billion (2033)
CAGR (2021-2033): 15.16%
Country-Specific Insight: The APAC region is the global leader, projected to account for a massive 42.5% of the global market in 2025. China is the undisputed market driver, expected to hold 17.55% of the global market alone. India (7.10%) and Japan (5.48%) are other major contributors with significant growth trajectories.
Regional Dynamics:
Drivers
- Aggressive government mandates and subsidies in China, making it the world's largest EV market.
- Dominance in the global battery manufacturing and supply chain, leading to cost advantages.
- Rapid urbanization and severe air pollution in major cities are pushing governments and consumers towards cleaner mobility solutions.
Trends
- Proliferation of a wide range of EV models, from low-cost micro-EVs to premium sedans and SUVs.
- Innovation in battery-swapping technology as an alternative to conventional charging, especially in China and India.
- Strong growth in the electric two- and three-wheeler segments, which dominate mobility in many Southeast Asian countries.
Restraints
- Inconsistent charging infrastructure and grid stability outside of major metropolitan areas.
- Affordability remains a major barrier in developing nations within the region.
- Intense competition and price wars among a large number of domestic manufacturers can impact profitability.
Technology Focus
The APAC region's technology focus is on cost-effective battery chemistries like Lithium Iron Phosphate (LFP), manufacturing process innovation to drive down costs, and the development of battery swapping infrastructure. There is also a strong focus on software for connected car services tailored to local consumer preferences.
South America Electric Vehicle Market Analysis
Market Size: $37.235 Billion (2021) -> $59.789 Billion (2025) -> $156.729 Billion (2033)
CAGR (2021-2033): 12.802%
Country-Specific Insight: South America represents an emerging market, holding approximately 7.1% of the global EV market share in 2025. Brazil is the largest market in the region, accounting for an estimated 3.05% of the global total in 2025, with countries like Colombia and Argentina also beginning to build momentum.
Regional Dynamics:
Drivers
- Abundant renewable energy resources, particularly hydropower, which can provide clean electricity for charging.
- Growing government interest in reducing dependence on imported oil and curbing urban pollution.
- Introduction of electric buses for public transportation in major cities like Santiago and Bogotá.
Trends
- Focus on electrification of public transport and commercial fleets as an initial adoption strategy.
- Entry of Chinese EV brands offering more affordable models compared to European and American counterparts.
- Growing local assembly and manufacturing initiatives to reduce import tariffs and costs.
Restraints
- High import taxes on vehicles and a lack of strong, widespread government incentives for consumers.
- Limited public charging infrastructure and low consumer awareness.
- Economic volatility and currency fluctuations impact vehicle affordability and market stability.
Technology Focus
Technology adoption in this region is focused on robust and cost-effective EVs suitable for varied road conditions. There is a particular interest in leveraging the region's ethanol production capabilities for hybrid-electric vehicles as a transitional technology, alongside the gradual introduction of pure BEVs.
Africa Electric Vehicle Market Analysis
Market Size: $14.698 Billion (2021) -> $26.105 Billion (2025) -> $74.633 Billion (2033)
CAGR (2021-2033): 14.032%
Country-Specific Insight: Africa is a nascent but high-potential market, representing about 3.1% of the global EV share in 2025. South Africa is the regional leader, holding an estimated 1.33% of the global market in 2025, with growing interest in countries like Nigeria and Kenya, particularly in the two-wheeler and public transit segments.
Regional Dynamics:
Drivers
- Abundant solar energy potential offers a pathway for decentralized, clean charging solutions.
- Growing startup ecosystem focused on electric mobility, particularly for two-wheelers and last-mile delivery.
- Governmental goals to combat severe urban air pollution and reduce fuel import costs.
Trends
- Adoption of electric motorcycles ("e-bodas") for ride-hailing and delivery services is a key entry point.
- Pilot programs for electric buses in major metropolitan areas are gaining traction.
- Development of local assembly plants for EVs to create jobs and lower costs.
Restraints
- Prohibitively high cost of new EVs for the vast majority of the population.
- Extremely limited charging infrastructure and unreliable electricity grids.
- Lack of comprehensive government policies and financial incentives to stimulate demand.
Technology Focus
The primary technology focus is on durable, low-cost electric two- and three-wheelers with swappable batteries. For four-wheeled vehicles, the focus is on rugged designs suitable for challenging road conditions. Off-grid, solar-powered charging stations are a key area of innovation for the region.
Middle East Electric Vehicle Market Analysis
Market Size: $27.437 Billion (2021) -> $45.473 Billion (2025) -> $126.875 Billion (2033)
CAGR (2021-2033): 13.685%
Country-Specific Insight: The Middle East is a growing market driven by economic diversification, accounting for an estimated 5.4% of the global EV market in 2025. Saudi Arabia (2.20% global share) and the UAE are leading this transition, investing heavily in infrastructure as part of their long-term national vision plans.
Regional Dynamics:
Drivers
- Strong government-led economic diversification initiatives (e.g., Saudi Vision 2030, UAE Net Zero 2050).
- High disposable income and a penchant for luxury and high-technology vehicles.
- Investments in smart city projects (like NEOM) that have EV infrastructure at their core.
Trends
- Rapid adoption of premium and luxury EV models from leading global brands.
- Government and state-owned entities are leading the way by electrifying their vehicle fleets.
- Development of domestic EV manufacturing capabilities, such as the Ceer brand in Saudi Arabia.
Restraints
- Extreme heat and climate conditions can negatively affect battery performance and longevity.
- Historically low gasoline prices reduce the economic incentive for consumers to switch to EVs.
- A deeply ingrained car culture centered around powerful, large-engine ICE vehicles.
Technology Focus
The technology focus in the Middle East is on advanced battery cooling systems to cope with high ambient temperatures, luxury in-cabin technology and connectivity, and the development of high-power charging networks to cater to premium, long-range EVs.
Key Takeaways
- The global electric vehicle market is on a trajectory to grow fivefold, from $489.94 Billion in 2021 to over $2.48 Trillion in 2033, demonstrating a powerful and sustained shift towards e-mobility.
- The Asia-Pacific region, commanding 42.5% of the market by 2025, is the undisputed epicenter of the EV industry, driven by China's dominant manufacturing ecosystem and supportive policies, with India emerging as a key growth market.
- Government intervention through financial incentives, emission regulations, and infrastructure investment is the most critical factor accelerating EV adoption, with the strongest markets directly correlating with the most supportive regulatory environments.
- While the outlook is overwhelmingly positive, sustained growth hinges on overcoming universal challenges: reducing the high upfront cost of EVs, expanding charging infrastructure beyond urban centers, and securing a stable, ethical supply chain for battery raw materials.
The automobile and transportation industry is in the midst of a major shift, driven by advancements in sustainable and intelligent mobility. Key drivers for the Electric Vehicle Market Analysis market include the move to electrification (EVs, hybrids), breakthroughs in autonomous driving, and the rise of connected vehicles powered by IoT and AI. These technologies are enhancing everything from personal transport to fleet management and last-mile delivery. However, the industry faces challenges, primarily from strict emissions regulations and evolving compliance standards, as well as growing cybersecurity and data privacy concerns. Despite these obstacles, significant opportunities exist for companies that can innovate and adapt. By capitalizing on the trends toward sustainable technology and intelligent mobility solutions, businesses in the Electric Vehicle Market Analysis market can secure a strong competitive position for future growth.
Trump’s Tariff Analysis
During the Trump administration, tariffs were imposed on a wide range of Chinese imports, including electric vehicle components like batteries, motors, and electronics, raising costs for U.S.-based EV manufacturers. For example, Tesla was forced to renegotiate supply chains and applied for tariff exemptions on key components like computer chips and chargers. The 25% tariff on Chinese-made battery cells significantly impacted price competitiveness and production timelines. As a response, several companies, including Tesla and GM, increased investment in domestic manufacturing to reduce reliance on imports. While the tariffs created short-term cost pressures and supply chain disruptions, they also accelerated efforts toward localization, onshoring, and vertical integration in the U.S. EV industry.
Analyst Conclusion
Our study will explain complete manufacturing process along with major raw materials required to manufacture end-product. This report helps to make effective decisions determining product position and will assist you to understand opportunities and threats around the globe.
The Electric Vehicle Market Analysis is witnessing significant growth in the near future.
In 2023, the Two Wheeler segment accounted for a notable share of the Electric Vehicle Market Analysis.

Sneha Singh is a Research Analyst at Cognitive Market Research & Consulting with a strong focus on the Automotive & Transportation and Transport & Logistics sectors. She supports organizations with strategic market insights and industry intelligence, helping businesses understand market dynamics, evaluate emerging opportunities, and make informed decisions in an increasingly evolving transportation landscape.
Sneha brings extensive experience in market assessment, competitive benchmarking, supply chain analysis, customer and stakeholder research, regulatory evaluation, and industry trend monitoring. Her work involves a combination of primary and secondary research methodologies, including expert interviews, stakeholder surveys, and comprehensive analysis of industry data, enabling clients to gain a holistic understanding of market developments and growth potential.
At Cognitive Market Research & Consulting, she contributes to market research reports, custom consulting projects, and survey-based studies across a broad range of segments, including passenger vehicles, commercial vehicles, electric mobility, automotive components, freight transportation, warehousing, logistics services, and supply chain technologies. Her research helps organizations evaluate market potential, understand competitive landscapes, assess investment opportunities, and develop effective business strategies.
Known for her analytical approach and attention to detail, Sneha transforms complex market information into actionable insights that support strategic planning and long-term growth. Her commitment to research excellence enables clients to navigate industry challenges, capitalize on emerging trends, and build sustainable competitive advantages in global transportation and logistics markets.
Frequently Asked Questions
Electric Vehicle Market Analysis market size and growth rate is provided in the report covering 2021-2025 historical and 2025-2033 forecast data.
Major factors including drivers, restraints, opportunities and challenges are analyzed with detailed insights.
Top manufacturers BYD, Tesla, Hyundai Motor Group, General Motors, Volkswagen, Renault and others are profiled in the report.
Segments include Vehicle Type, Propulsion and additional sub-segments.
Regional analysis covers all major markets. The report identifies the dominant region and provides country-level data.
Sample pages can be obtained on demand from the website. 24/7 chat support and direct call services are available.
★ Reviews
Rate this report
Electric Vehicle Market Analysis — Table of Contents
Disclaimer:
- This is just a redacted sample pages of the actual deliverable report and only for representative purposes
- Charts/Graphs/Numbers/data are only for Representative purposes and do not depict actual statistics.
- The table of Contents differs according to the user License selection. Current Displayed TOC is for the Corporate User License Report Edition. TOC Customization options: Add or Remove section/s Or chapter/s from the report.
- Specific Tables, Graphs, Sections, and Chapters can be ordered at a discounted price.
- If applicable; On Request Volume Data will also be provided (at an Additional Cost).
| Vehicle Type | Two Wheeler, Passenger Vehicle, Commercial Vehicle |
| Propulsion | Battery Electric Vehicle (BEV), Hybrid Electric Vehicle ( HEV) |
| Vehicle Class | Low Priced, Mid-priced, Luxury |
| Top Speed | <125 MPH, >125 MPH |
| Vehicle Drive Type | Front-Wheel Drive, Rear Wheel Drive, All Wheel Drive |
| EV Charging Point Type | Normal Charging, Super Charging, Inductive Charging |
| Vehicle Connectivity | V2B, Vehicle to Grid, Vehicle to Vehicle |
| Component | Battery Pack & High Voltage Component, Motor, Brake, Wheel & Suspension, Body & Chassis, Others |
| End Use | Private Use, Commercial Use, Industrial Use |
| List of Competitors | BYD, Tesla, Hyundai Motor Group, General Motors, Volkswagen, Renault |
- 1.1 Global Power Realignment & Strategic Alliances
- 1.2 Geopolitical Risk Landscape & Conflict Hotspots
- 1.3 International Trade Relations & Market Access Environment
- 1.4 Regulatory & Policy Shifts Impacting Cross-Border Operations
- 1.5 Supply Chain Resilience, Localization & Resource Nationalism
- 1.6 Technology Sovereignty & Digital Geopolitics
- 1.7 Strategic Implications for Investment, Growth & Market Entry
- 2.1 Competitive Landscape Disruption & Strategic Shifts
- 2.2 AI-Driven Transformation of Industry Value Chain
- 2.3 Evolution of Business Models & Revenue Streams
- 2.4 Operational Efficiency & Cost Structure Transformation
- 2.5 Product, Service & Innovation Acceleration
- 2.6 Customer Behavior & Demand Evolution
- 2.7 Future Outlook: AI-Led Market Evolution & Strategic Implications
- 3.1 Global Electric Vehicle Revenue Market Size, Trend Analysis 2022 - 2034
- 3.2 Global Electric Vehicle Volume Market Sales, Trend Analysis 2022 - 2034
-
3.3 Global Electric Vehicle Market Size By Regions 2022 - 2034
Global Market has been segmented on the basis 5 major regions such as North America, Europe, Asia-Pacific, Middle East & Africa, and Latin America.
- 3.3.1 Global Electric Vehicle Revenue Market Size By Region
- 3.3.2 Global Electric Vehicle Volume Market Sales By Region
-
3.4 Global Electric Vehicle Market Size By Vehicle Type 2022 - 2034
- 3.4.1 Two Wheeler Market Size
- 3.4.2 Passenger Vehicle Market Size
- 3.4.3 Commercial Vehicle Market Size
-
3.5 Global Electric Vehicle Volume Market Sales By Vehicle Type 2022 - 2034
- 3.5.1 Two Wheeler Sales Volume
- 3.5.2 Passenger Vehicle Sales Volume
- 3.5.3 Commercial Vehicle Sales Volume
-
3.6 Global Electric Vehicle Market Size By Propulsion 2022 - 2034
- 3.6.1 Battery Electric Vehicle (BEV) Market Size
- 3.6.2 Hybrid Electric Vehicle ( HEV) Market Size
-
3.7 Global Electric Vehicle Volume Market Sales By Propulsion 2022 - 2034
- 3.7.1 Battery Electric Vehicle (BEV) Sales Volume
- 3.7.2 Hybrid Electric Vehicle ( HEV) Sales Volume
-
3.8 Global Electric Vehicle Market Size By Vehicle Class 2022 - 2034
- 3.8.1 Low Priced Market Size
- 3.8.2 Mid-priced Market Size
- 3.8.3 Luxury Market Size
-
3.9 Global Electric Vehicle Volume Market Sales By Vehicle Class 2022 - 2034
- 3.9.1 Low Priced Sales Volume
- 3.9.2 Mid-priced Sales Volume
- 3.9.3 Luxury Sales Volume
-
3.10 Global Electric Vehicle Market Size By Top Speed for 2022 - 2034
- 3.10.1 <125 MPH Market Size
- 3.10.2 >125 MPH Market Size
-
3.11 Global Electric Vehicle Volume Market Sales By Top Speed 2022 - 2034
- 3.11.1 <125 MPH Sales Volume
- 3.11.2 >125 MPH Sales Volume
-
3.12 Global Electric Vehicle Market Size By Vehicle Drive Type for 2022 - 2034
- 3.12.1 Front-Wheel Drive Market Size
- 3.12.2 Rear Wheel Drive Market Size
- 3.12.3 All Wheel Drive Market Size
-
3.13 Global Electric Vehicle Volume Market Sales By Vehicle Drive Type 2022 - 2034
- 3.13.1 Front-Wheel Drive Sales Volume
- 3.13.2 Rear Wheel Drive Sales Volume
- 3.13.3 All Wheel Drive Sales Volume
-
3.14 Global Electric Vehicle Market Size By EV Charging Point Type for 2022 - 2034
- 3.14.1 Normal Charging Market Size
- 3.14.2 Super Charging Market Size
- 3.14.3 Inductive Charging Market Size
- 3.14.1 Normal Charging Market Size
- 3.14.2 Super Charging Market Size
- 3.14.3 Inductive Charging Market Size
-
3.15 Global Electric Vehicle Volume Market Sales By EV Charging Point Type 2022 - 2034
- 3.15.1 Normal Charging Sales Volume
- 3.15.2 Super Charging Sales Volume
- 3.15.3 Inductive Charging Sales Volume
-
3.16 Global Electric Vehicle Market Size By Vehicle Connectivity for 2022 - 2034
- 3.16.1 V2B Market Size
- 3.16.2 Vehicle to Grid Market Size
- 3.16.3 Vehicle to Vehicle Market Size
-
3.17 Global Electric Vehicle Volume Market Sales By Vehicle Connectivity 2022 - 2034
- 3.17.1 V2B Sales Volume
- 3.17.2 Vehicle to Grid Sales Volume
- 3.17.3 Vehicle to Vehicle Sales Volume
-
3.18 Global Electric Vehicle Market Size By Component for 2022 - 2034
- 3.18.1 Battery Pack & High Voltage Component Market Size
- 3.18.2 Motor Market Size
- 3.18.3 Brake Market Size
- 3.18.4 Wheel & Suspension Market Size
- 3.18.5 Body & Chassis Market Size
- 3.18.6 Others Market Size
- 3.19 Global Electric Vehicle Volume Market Sales By Component 2022 - 2034
-
3.20 Global Electric Vehicle Market Size By End Use for 2022 - 2034
- 3.20.1 Private Use Market Size
- 3.20.2 Commercial Use Market Size
- 3.20.3 Industrial Use Market Size
-
3.21 Global Electric Vehicle Volume Market Sales By End Use 2022 - 2034
- 3.21.1 Private Use Sales Volume
- 3.21.2 Commercial Use Sales Volume
- 3.21.3 Industrial Use Sales Volume
- 3.22 Global Level Competitor Analysis (Subject to Data Availability (Private Players))
-
3.23 Executive Summary Global Market (2021 vs 2025 vs 2033)
You can purchase only the Executive Summary of Global Market (2019 vs 2024 vs 2031)
- 3.23.1 Regional Market Revenue Summary 2021 vs 2025 vs 2033
- 3.23.2 Regional Volume Market Summary 2021 vs 2025 vs 2033
- 3.23.3 Global Market Revenue Split By Vehicle Type
- 3.23.4 Global Volume Market Split By Vehicle Type
- 3.23.5 Global Market Revenue Split By Propulsion
- 3.23.6 Global Volume Market Split By Propulsion
- 3.23.7 Global Market Revenue Split By Vehicle Class
- 3.23.8 Global Volume Market Split By Vehicle Class
- 3.23.9 Global Market Revenue Split By Top Speed
- 3.23.10 Global Volume Market Split By Top Speed
- 3.23.11 Global Market Revenue Split By Vehicle Drive Type
- 3.23.12 Global Volume Market Split By Vehicle Drive Type
- 3.23.13 Global Volume Market Split By EV Charging Point Type
- 3.23.14 Global Market Revenue Split By Vehicle Connectivity
- 3.23.15 Global Volume Market Split By Vehicle Connectivity
- 3.23.16 Global Market Revenue Split By Component
- 3.23.17 Global Volume Market Split By Component
- 3.23.18 Global Market Revenue Split By End Use
- 3.23.19 Global Volume Market Split By End Use
-
3.23.20 Global Market Dynamics, Trends, Drivers, Restraints, Opportunities
Global Market Dynamics, Trends, Drivers, Restraints, Opportunities, Only Pointers will be deliverable
-
4.1 North America Electric Vehicle Market Outlook
- 4.1.1 North America Electric Vehicle Market Size 2022 - 2034
- 4.1.2 North America Electric Vehicle Volume Market Sales 2022 - 2034
- 4.1.3 North America Electric Vehicle Market Size By Country 2022 - 2034
- 4.1.4 North America Electric Vehicle Volume Market Sales By Country 2022 - 2034
-
4.1.5 North America Electric Vehicle Market Size by Vehicle Type 2022 - 2034
- 4.1.5.1 North America Two Wheeler Market Size
- 4.1.5.2 North America Passenger Vehicle Market Size
- 4.1.5.3 North America Commercial Vehicle Market Size
-
4.1.6 North America Electric Vehicle Volume Market Sales by Vehicle Type 2022 - 2034
- 4.1.6.1 North America Two Wheeler Sales Volume
- 4.1.6.2 North America Passenger Vehicle Sales Volume
- 4.1.6.3 North America Commercial Vehicle Sales Volume
-
4.1.7 North America Electric Vehicle Market Size by Propulsion 2022 - 2034
- 4.1.7.1 North America Battery Electric Vehicle (BEV) Market Size
- 4.1.7.2 North America Hybrid Electric Vehicle ( HEV) Market Size
-
4.1.8 North America Electric Vehicle Volume Market Sales by Propulsion 2022 - 2034
- 4.1.8.1 North America Battery Electric Vehicle (BEV) Sales Volume
- 4.1.8.2 North America Hybrid Electric Vehicle ( HEV) Sales Volume
-
4.1.9 North America Electric Vehicle Market Size by Vehicle Class 2022 - 2034
- 4.1.9.1 North America Low Priced Market Size
- 4.1.9.2 North America Mid-priced Market Size
- 4.1.9.3 North America Luxury Market Size
-
4.1.10 North America Electric Vehicle Volume Market Sales by Vehicle Class 2022 - 2034
- 4.1.10.1 North America Low Priced Sales Volume
- 4.1.10.2 North America Mid-priced Sales Volume
- 4.1.10.3 North America Luxury Sales Volume
-
4.1.11 North America Electric Vehicle Market Size by Top Speed 2022 - 2034
- 4.1.11.1 North America <125 MPH Market Size
- 4.1.11.2 North America >125 MPH Market Size
-
4.1.12 North America Electric Vehicle Volume Market Sales by Top Speed 2022 - 2034
- 4.1.12.1 North America <125 MPH Sales Volume
- 4.1.12.2 North America >125 MPH Sales Volume
-
4.1.13 North America Electric Vehicle Market Size by Vehicle Drive Type 2022 - 2034
- 4.1.13.1 North America Front-Wheel Drive Market Size
- 4.1.13.2 North America Rear Wheel Drive Market Size
- 4.1.13.3 North America All Wheel Drive Market Size
-
4.1.14 North America Electric Vehicle Volume Market Sales by Vehicle Drive Type 2022 - 2034
- 4.1.14.1 North America Front-Wheel Drive Sales Volume
- 4.1.14.2 North America Rear Wheel Drive Sales Volume
- 4.1.14.3 North America All Wheel Drive Sales Volume
-
4.1.15 North America Electric Vehicle Market Size by EV Charging Point Type 2022 - 2034
- 4.1.15.1 North America Normal Charging Market Size
- 4.1.15.2 North America Super Charging Market Size
- 4.1.15.3 North America Inductive Charging Market Size
-
4.1.16 North America Electric Vehicle Volume Market Sales by EV Charging Point Type 2022 - 2034
- 4.1.16.1 North America Normal Charging Sales Volume
- 4.1.16.2 North America Super Charging Sales Volume
- 4.1.16.3 North America Inductive Charging Sales Volume
-
4.1.17 North America Electric Vehicle Market Size by Vehicle Connectivity 2022 - 2034
- 4.1.17.1 North America V2B Market Size
- 4.1.17.2 North America Vehicle to Grid Market Size
- 4.1.17.3 North America Vehicle to Vehicle Market Size
-
4.1.18 North America Electric Vehicle Volume Market Sales by Vehicle Connectivity 2022 - 2034
- 4.1.18.1 North America V2B Sales Volume
- 4.1.18.2 North America Vehicle to Grid Sales Volume
- 4.1.18.3 North America Vehicle to Vehicle Sales Volume
-
4.1.19 North America Electric Vehicle Market Size by Component 2022 - 2034
- 4.1.19.1 North America Battery Pack & High Voltage Component Market Size
- 4.1.19.2 North America Motor Market Size
- 4.1.19.3 North America Brake Market Size
- 4.1.19.4 North America Wheel & Suspension Market Size
- 4.1.19.5 North America Body & Chassis Market Size
- 4.1.19.6 North America Others Market Size
-
4.1.20 North America Electric Vehicle Volume Market Sales by Component 2022 - 2034
- 4.1.20.1 North America Battery Pack & High Voltage Component Sales Volume
- 4.1.20.2 North America Motor Sales Volume
- 4.1.20.3 North America Brake Sales Volume
- 4.1.20.4 North America Wheel & Suspension Sales Volume
- 4.1.20.5 North America Body & Chassis Sales Volume
- 4.1.20.6 North America Others Sales Volume
-
4.1.21 North America Electric Vehicle Market Size by End Use 2022 - 2034
- 4.1.21.1 North America Private Use Market Size
- 4.1.21.2 North America Commercial Use Market Size
- 4.1.21.3 North America Industrial Use Market Size
-
4.1.22 North America Electric Vehicle Volume Market Sales by End Use 2022 - 2034
- 4.1.22.1 North America Private Use Sales Volume
- 4.1.22.2 North America Commercial Use Sales Volume
- 4.1.22.3 North America Industrial Use Sales Volume
-
5.1 Europe Electric Vehicle Market Outlook
- 5.1.1 Europe Electric Vehicle Market Size 2022 - 2034
- 5.1.2 Europe Electric Vehicle Volume Market Sales 2022 - 2034
- 5.1.3 Europe Electric Vehicle Market Size By Country 2022 - 2034
- 5.1.4 Europe Electric Vehicle Volume Market Sales By Country 2022 - 2034
-
5.1.5 Europe Electric Vehicle Market Size by Vehicle Type 2022 - 2034
- 5.1.5.1 Europe Two Wheeler Market Size
- 5.1.5.2 Europe Passenger Vehicle Market Size
- 5.1.5.3 Europe Commercial Vehicle Market Size
-
5.1.6 Europe Electric Vehicle Volume Market Sales by Vehicle Type 2022 - 2034
- 5.1.6.1 Europe Two Wheeler Sales Volume
- 5.1.6.2 Europe Passenger Vehicle Sales Volume
- 5.1.6.3 Europe Commercial Vehicle Sales Volume
-
5.1.7 Europe Electric Vehicle Market Size by Propulsion 2022 - 2034
- 5.1.7.1 Europe Battery Electric Vehicle (BEV) Market Size
- 5.1.7.2 Europe Hybrid Electric Vehicle ( HEV) Market Size
-
5.1.8 Europe Electric Vehicle Volume Market Sales by Propulsion 2022 - 2034
- 5.1.8.1 Europe Battery Electric Vehicle (BEV) Sales Volume
- 5.1.8.2 Europe Hybrid Electric Vehicle ( HEV) Sales Volume
-
5.1.9 Europe Electric Vehicle Market Size by Vehicle Class 2022 - 2034
- 5.1.9.1 Europe Low Priced Market Size
- 5.1.9.2 Europe Mid-priced Market Size
- 5.1.9.3 Europe Luxury Market Size
-
5.1.10 Europe Electric Vehicle Volume Market Sales by Vehicle Class 2022 - 2034
- 5.1.10.1 Europe Low Priced Sales Volume
- 5.1.10.2 Europe Mid-priced Sales Volume
- 5.1.10.3 Europe Luxury Sales Volume
-
5.1.11 Europe Electric Vehicle Market Size by Top Speed 2022 - 2034
- 5.1.11.1 Europe <125 MPH Market Size
- 5.1.11.2 Europe >125 MPH Market Size
-
5.1.12 Europe Electric Vehicle Volume Market Sales by Top Speed 2022 - 2034
- 5.1.12.1 Europe <125 MPH Sales Volume
- 5.1.12.2 Europe >125 MPH Sales Volume
-
5.1.13 Europe Electric Vehicle Market Size by Vehicle Drive Type 2022 - 2034
- 5.1.13.1 Europe Front-Wheel Drive Market Size
- 5.1.13.2 Europe Rear Wheel Drive Market Size
- 5.1.13.3 Europe All Wheel Drive Market Size
-
5.1.14 Europe Electric Vehicle Volume Market Sales by Vehicle Drive Type 2022 - 2034
- 5.1.14.1 Europe Front-Wheel Drive Sales Volume
- 5.1.14.2 Europe Rear Wheel Drive Sales Volume
- 5.1.14.3 Europe All Wheel Drive Sales Volume
-
5.1.15 Europe Electric Vehicle Market Size by EV Charging Point Type 2022 - 2034
- 5.1.15.1 Europe Normal Charging Market Size
- 5.1.15.2 Europe Super Charging Market Size
- 5.1.15.3 Europe Inductive Charging Market Size
-
5.1.16 Europe Electric Vehicle Volume Market Sales by EV Charging Point Type 2022 - 2034
- 5.1.16.1 Europe Normal Charging Sales Volume
- 5.1.16.2 Europe Super Charging Sales Volume
- 5.1.16.3 Europe Inductive Charging Sales Volume
- 5.1.17 Europe Electric Vehicle Market Size by Vehicle Connectivity 2022 - 2034
-
5.1.18 Europe Electric Vehicle Volume Market Sales by Vehicle Connectivity 2022 - 2034
- 5.1.18.1 Europe V2B Sales Volume
- 5.1.18.2 Europe Vehicle to Grid Sales Volume
- 5.1.18.3 Europe Vehicle to Vehicle Sales Volume
-
5.1.19 Europe Electric Vehicle Market Size by Component 2022 - 2034
- 5.1.19.1 Europe Battery Pack & High Voltage Component Market Size
- 5.1.19.2 Europe Motor Market Size
- 5.1.19.3 Europe Brake Market Size
- 5.1.19.4 Europe Wheel & Suspension Market Size
- 5.1.19.5 Europe Body & Chassis Market Size
- 5.1.19.6 Europe Others Market Size
-
5.1.20 Europe Electric Vehicle Volume Market Sales by Component 2022 - 2034
- 5.1.20.1 Europe Battery Pack & High Voltage Component Sales Volume
- 5.1.20.2 Europe Motor Sales Volume
- 5.1.20.3 Europe Brake Sales Volume
- 5.1.20.4 Europe Wheel & Suspension Sales Volume
- 5.1.20.5 Europe Body & Chassis Sales Volume
- 5.1.20.6 Europe Others Sales Volume
-
5.1.21 Europe Electric Vehicle Market Size by End Use 2022 - 2034
- 5.1.21.1 Europe Private Use Market Size
- 5.1.21.2 Europe Commercial Use Market Size
- 5.1.21.3 Europe Industrial Use Market Size
-
5.1.22 Europe Electric Vehicle Volume Market Sales by End Use 2022 - 2034
- 5.1.22.1 Europe Private Use Sales Volume
- 5.1.22.2 Europe Commercial Use Sales Volume
- 5.1.22.3 Europe Industrial Use Sales Volume
-
6.1 Asia Pacific Electric Vehicle Market Outlook
- 6.1.1 Asia Pacific Electric Vehicle Market Size 2022 - 2034
- 6.1.2 Asia Pacific Electric Vehicle Volume Market Sales 2022 - 2034
- 6.1.3 Asia Pacific Electric Vehicle Market Size By Country 2022 - 2034
- 6.1.4 Asia Pacific Electric Vehicle Volume Market Sales By Country 2022 - 2034
-
6.1.5 Asia Pacific Electric Vehicle Market Size by Vehicle Type 2022 - 2034
- 6.1.5.1 Asia Pacific Two Wheeler Market Size
- 6.1.5.2 Asia Pacific Passenger Vehicle Market Size
- 6.1.5.3 Asia Pacific Commercial Vehicle Market Size
-
6.1.6 Asia Pacific Electric Vehicle Volume Market Sales by Vehicle Type 2022 - 2034
- 6.1.6.1 Asia Pacific Two Wheeler Sales Volume
- 6.1.6.2 Asia Pacific Passenger Vehicle Sales Volume
- 6.1.6.3 Asia Pacific Commercial Vehicle Sales Volume
-
6.1.7 Asia Pacific Electric Vehicle Market Size by Propulsion 2022 - 2034
- 6.1.7.1 Asia Pacific Battery Electric Vehicle (BEV) Market Size
- 6.1.7.2 Asia Pacific Hybrid Electric Vehicle ( HEV) Market Size
-
6.1.8 Asia Pacific Electric Vehicle Volume Market Sales by Propulsion 2022 - 2034
- 6.1.8.1 Asia Pacific Battery Electric Vehicle (BEV) Sales Volume
- 6.1.8.2 Asia Pacific Hybrid Electric Vehicle ( HEV) Sales Volume
-
6.1.9 Asia Pacific Electric Vehicle Market Size by Vehicle Class 2022 - 2034
- 6.1.9.1 Asia Pacific Low Priced Market Size
- 6.1.9.2 Asia Pacific Mid-priced Market Size
- 6.1.9.3 Asia Pacific Luxury Market Size
-
6.1.10 Asia Pacific Electric Vehicle Volume Market Sales by Vehicle Class 2022 - 2034
- 6.1.10.1 Asia Pacific Low Priced Sales Volume
- 6.1.10.2 Asia Pacific Mid-priced Sales Volume
- 6.1.10.3 Asia Pacific Luxury Sales Volume
-
6.1.11 Asia Pacific Electric Vehicle Market Size by Top Speed 2022 - 2034
- 6.1.11.1 Asia Pacific <125 MPH Market Size
- 6.1.11.2 Asia Pacific >125 MPH Market Size
-
6.1.12 Asia Pacific Electric Vehicle Volume Market Sales by Top Speed 2022 - 2034
- 6.1.12.1 Asia Pacific <125 MPH Sales Volume
- 6.1.12.2 Asia Pacific >125 MPH Sales Volume
-
6.1.13 Asia Pacific Electric Vehicle Market Size by Vehicle Drive Type 2022 - 2034
- 6.1.13.1 Asia Pacific Front-Wheel Drive Market Size
- 6.1.13.2 Asia Pacific Rear Wheel Drive Market Size
- 6.1.13.3 Asia Pacific All Wheel Drive Market Size
-
6.1.14 Asia Pacific Electric Vehicle Volume Market Sales by Vehicle Drive Type 2022 - 2034
- 6.1.14.1 Asia Pacific Front-Wheel Drive Sales Volume
- 6.1.14.2 Asia Pacific Rear Wheel Drive Sales Volume
- 6.1.14.3 Asia Pacific All Wheel Drive Sales Volume
-
6.1.15 Asia Pacific Electric Vehicle Market Size by EV Charging Point Type 2022 - 2034
- 6.1.15.1 Asia Pacific Normal Charging Market Size
- 6.1.15.2 Asia Pacific Super Charging Market Size
- 6.1.15.3 Asia Pacific Inductive Charging Market Size
-
6.1.16 Asia Pacific Electric Vehicle Volume Market Sales by EV Charging Point Type 2022 - 2034
- 6.1.16.1 Asia Pacific Normal Charging Sales Volume
- 6.1.16.2 Asia Pacific Super Charging Sales Volume
- 6.1.16.3 Asia Pacific Inductive Charging Sales Volume
-
6.1.17 Asia Pacific Electric Vehicle Market Size by Vehicle Connectivity 2022 - 2034
- 6.1.17.1 Asia Pacific V2B Market Size
- 6.1.17.2 Asia Pacific Vehicle to Grid Market Size
- 6.1.17.3 Asia Pacific Vehicle to Vehicle Market Size
-
6.1.18 Asia Pacific Electric Vehicle Volume Market Sales by Vehicle Connectivity 2022 - 2034
- 6.1.18.1 Asia Pacific V2B Sales Volume
- 6.1.18.2 Asia Pacific Vehicle to Grid Sales Volume
- 6.1.18.3 Asia Pacific Vehicle to Vehicle Sales Volume
-
6.1.19 Asia Pacific Electric Vehicle Market Size by Component 2022 - 2034
- 6.1.19.1 Asia Pacific Battery Pack & High Voltage Component Market Size
- 6.1.19.2 Asia Pacific Motor Market Size
- 6.1.19.3 Asia Pacific Brake Market Size
- 6.1.19.4 Asia Pacific Wheel & Suspension Market Size
- 6.1.19.5 Asia Pacific Body & Chassis Market Size
- 6.1.19.6 Asia Pacific Others Market Size
-
6.1.20 Asia Pacific Electric Vehicle Volume Market Sales by Component 2022 - 2034
- 6.1.20.1 Asia Pacific Battery Pack & High Voltage Component Sales Volume
- 6.1.20.2 Asia Pacific Motor Sales Volume
- 6.1.20.3 Asia Pacific Brake Sales Volume
- 6.1.20.4 Asia Pacific Wheel & Suspension Sales Volume
- 6.1.20.5 Asia Pacific Body & Chassis Sales Volume
- 6.1.20.6 Asia Pacific Others Sales Volume
-
6.1.21 Asia Pacific Electric Vehicle Market Size by End Use 2022 - 2034
- 6.1.21.1 Asia Pacific Private Use Market Size
- 6.1.21.2 Asia Pacific Commercial Use Market Size
- 6.1.21.3 Asia Pacific Industrial Use Market Size
-
6.1.22 Asia Pacific Electric Vehicle Volume Market Sales by End Use 2022 - 2034
- 6.1.22.1 Asia Pacific Private Use Sales Volume
- 6.1.22.2 Asia Pacific Commercial Use Sales Volume
- 6.1.22.3 Asia Pacific Industrial Use Sales Volume
-
7.1 South America Electric Vehicle Market Outlook
- 7.1.1 South America Electric Vehicle Market Size 2022 - 2034
- 7.1.2 South America Electric Vehicle Volume Market Sales 2022 - 2034
- 7.1.3 South America Electric Vehicle Market Size By Country 2022 - 2034
- 7.1.4 South America Electric Vehicle Volume Market Sales By Country 2022 - 2034
-
7.1.5 South America Electric Vehicle Market Size by Vehicle Type 2022 - 2034
- 7.1.5.1 South America Two Wheeler Market Size
- 7.1.5.2 South America Passenger Vehicle Market Size
- 7.1.5.3 South America Commercial Vehicle Market Size
-
7.1.6 South America Electric Vehicle Volume Market Sales by Vehicle Type 2022 - 2034
- 7.1.6.1 South America Two Wheeler Sales Volume
- 7.1.6.2 South America Passenger Vehicle Sales Volume
- 7.1.6.3 South America Commercial Vehicle Sales Volume
-
7.1.7 South America Electric Vehicle Market Size by Propulsion 2022 - 2034
- 7.1.7.1 South America Battery Electric Vehicle (BEV) Market Size
- 7.1.7.2 South America Hybrid Electric Vehicle ( HEV) Market Size
-
7.1.8 South America Electric Vehicle Volume Market Sales by Propulsion 2022 - 2034
- 7.1.8.1 South America Battery Electric Vehicle (BEV) Sales Volume
- 7.1.8.2 South America Hybrid Electric Vehicle ( HEV) Sales Volume
-
7.1.9 South America Electric Vehicle Market Size by Vehicle Class 2022 - 2034
- 7.1.9.1 South America Low Priced Market Size
- 7.1.9.2 South America Mid-priced Market Size
- 7.1.9.3 South America Luxury Market Size
-
7.1.10 South America Electric Vehicle Volume Market Sales by Vehicle Class 2022 - 2034
- 7.1.10.1 South America Low Priced Sales Volume
- 7.1.10.2 South America Mid-priced Sales Volume
- 7.1.10.3 South America Luxury Sales Volume
-
7.1.11 South America Electric Vehicle Market Size by Top Speed 2022 - 2034
- 7.1.11.1 South America <125 MPH Market Size
- 7.1.11.2 South America >125 MPH Market Size
-
7.1.12 South America Electric Vehicle Volume Market Sales by Top Speed 2022 - 2034
- 7.1.12.1 South America <125 MPH Sales Volume
- 7.1.12.2 South America >125 MPH Sales Volume
-
7.1.13 South America Electric Vehicle Market Size by Vehicle Drive Type 2022 - 2034
- 7.1.13.1 South America Front-Wheel Drive Market Size
- 7.1.13.2 South America Rear Wheel Drive Market Size
- 7.1.13.3 South America All Wheel Drive Market Size
-
7.1.14 South America Electric Vehicle Volume Market Sales by Vehicle Drive Type 2022 - 2034
- 7.1.14.1 South America Front-Wheel Drive Sales Volume
- 7.1.14.2 South America Rear Wheel Drive Sales Volume
- 7.1.14.3 South America All Wheel Drive Sales Volume
-
7.1.15 South America Electric Vehicle Market Size by EV Charging Point Type 2022 - 2034
- 7.1.15.1 South America Normal Charging Market Size
- 7.1.15.2 South America Super Charging Market Size
- 7.1.15.3 South America Inductive Charging Market Size
-
7.1.16 South America Electric Vehicle Volume Market Sales by EV Charging Point Type 2022 - 2034
- 7.1.16.1 South America Normal Charging Sales Volume
- 7.1.16.2 South America Super Charging Sales Volume
- 7.1.16.3 South America Inductive Charging Sales Volume
-
7.1.17 South America Electric Vehicle Market Size by Vehicle Connectivity 2022 - 2034
- 7.1.17.1 South America V2B Market Size
- 7.1.17.2 South America Vehicle to Grid Market Size
- 7.1.17.3 South America Vehicle to Vehicle Market Size
-
7.1.18 South America Electric Vehicle Volume Market Sales by Vehicle Connectivity 2022 - 2034
- 7.1.18.1 South America V2B Sales Volume
- 7.1.18.2 South America Vehicle to Grid Sales Volume
- 7.1.18.3 South America Vehicle to Vehicle Sales Volume
-
7.1.19 South America Electric Vehicle Market Size by Component 2022 - 2034
- 7.1.19.1 South America Battery Pack & High Voltage Component Market Size
- 7.1.19.2 South America Motor Market Size
- 7.1.19.3 South America Brake Market Size
- 7.1.19.4 South America Wheel & Suspension Market Size
- 7.1.19.5 South America Body & Chassis Market Size
- 7.1.19.6 South America Others Market Size
-
7.1.20 South America Electric Vehicle Volume Market Sales by Component 2022 - 2034
- 7.1.20.1 South America Battery Pack & High Voltage Component Sales Volume
- 7.1.20.2 South America Motor Sales Volume
- 7.1.20.3 South America Brake Sales Volume
- 7.1.20.4 South America Wheel & Suspension Sales Volume
- 7.1.20.5 South America Body & Chassis Sales Volume
- 7.1.20.6 South America Others Sales Volume
-
7.1.21 South America Electric Vehicle Market Size by End Use 2022 - 2034
- 7.1.21.1 South America Private Use Market Size
- 7.1.21.2 South America Commercial Use Market Size
- 7.1.21.3 South America Industrial Use Market Size
-
7.1.22 South America Electric Vehicle Volume Market Sales by End Use 2022 - 2034
- 7.1.22.1 South America Private Use Sales Volume
- 7.1.22.2 South America Commercial Use Sales Volume
- 7.1.22.3 South America Industrial Use Sales Volume
-
8.1 Middle East Electric Vehicle Market Outlook
- 8.1.1 Middle East Electric Vehicle Market Size 2022 - 2034
- 8.1.2 Middle East Electric Vehicle Volume Market Sales 2022 - 2034
- 8.1.3 Middle East Electric Vehicle Market Size By Country 2022 - 2034
- 8.1.4 Middle East Electric Vehicle Volume Market Sales By Country 2022 - 2034
-
8.1.5 Middle East Electric Vehicle Market Size by Vehicle Type 2022 - 2034
- 8.1.5.1 Middle East Two Wheeler Market Size
- 8.1.5.2 Middle East Passenger Vehicle Market Size
- 8.1.5.3 Middle East Commercial Vehicle Market Size
-
8.1.6 Middle East Electric Vehicle Volume Market Sales by Vehicle Type 2022 - 2034
- 8.1.6.1 Middle East Two Wheeler Sales Volume
- 8.1.6.2 Middle East Passenger Vehicle Sales Volume
- 8.1.6.3 Middle East Commercial Vehicle Sales Volume
-
8.1.7 Middle East Electric Vehicle Market Size by Propulsion 2022 - 2034
- 8.1.7.1 Middle East Battery Electric Vehicle (BEV) Market Size
- 8.1.7.2 Middle East Hybrid Electric Vehicle ( HEV) Market Size
-
8.1.8 Middle East Electric Vehicle Volume Market Sales by Propulsion 2022 - 2034
- 8.1.8.1 Middle East Battery Electric Vehicle (BEV) Sales Volume
- 8.1.8.2 Middle East Hybrid Electric Vehicle ( HEV) Sales Volume
-
8.1.9 Middle East Electric Vehicle Market Size by Vehicle Class 2022 - 2034
- 8.1.9.1 Middle East Low Priced Market Size
- 8.1.9.2 Middle East Mid-priced Market Size
- 8.1.9.3 Middle East Luxury Market Size
-
8.1.10 Middle East Electric Vehicle Volume Market Sales by Vehicle Class 2022 - 2034
- 8.1.10.1 Middle East Low Priced Sales Volume
- 8.1.10.2 Middle East Mid-priced Sales Volume
- 8.1.10.3 Middle East Luxury Sales Volume
-
8.1.11 Middle East Electric Vehicle Market Size by Top Speed 2022 - 2034
- 8.1.11.1 Middle East <125 MPH Market Size
- 8.1.11.2 Middle East >125 MPH Market Size
-
8.1.12 Middle East Electric Vehicle Volume Market Sales by Top Speed 2022 - 2034
- 8.1.12.1 Middle East <125 MPH Sales Volume
- 8.1.12.2 Middle East >125 MPH Sales Volume
-
8.1.13 Middle East Electric Vehicle Market Size by Vehicle Drive Type 2022 - 2034
- 8.1.13.1 Middle East Front-Wheel Drive Market Size
- 8.1.13.2 Middle East Rear Wheel Drive Market Size
- 8.1.13.3 Middle East All Wheel Drive Market Size
-
8.1.14 Middle East Electric Vehicle Volume Market Sales by Vehicle Drive Type 2022 - 2034
- 8.1.14.1 Middle East Front-Wheel Drive Sales Volume
- 8.1.14.2 Middle East Rear Wheel Drive Sales Volume
- 8.1.14.3 Middle East All Wheel Drive Sales Volume
-
8.1.15 Middle East Electric Vehicle Market Size by EV Charging Point Type 2022 - 2034
- 8.1.15.1 Middle East Normal Charging Market Size
- 8.1.15.2 Middle East Super Charging Market Size
- 8.1.15.3 Middle East Inductive Charging Market Size
-
8.1.16 Middle East Electric Vehicle Volume Market Sales by EV Charging Point Type 2022 - 2034
- 8.1.16.1 Middle East Normal Charging Sales Volume
- 8.1.16.2 Middle East Super Charging Sales Volume
- 8.1.16.3 Middle East Inductive Charging Sales Volume
-
8.1.17 Middle East Electric Vehicle Market Size by Vehicle Connectivity 2022 - 2034
- 8.1.17.1 Middle East V2B Market Size
- 8.1.17.2 Middle East Vehicle to Grid Market Size
- 8.1.17.3 Middle East Vehicle to Vehicle Market Size
-
8.1.18 Middle East Electric Vehicle Volume Market Sales by Vehicle Connectivity 2022 - 2034
- 8.1.18.1 Middle East V2B Sales Volume
- 8.1.18.2 Middle East Vehicle to Grid Sales Volume
- 8.1.18.3 Middle East Vehicle to Vehicle Sales Volume
-
8.1.19 Middle East Electric Vehicle Market Size by Component 2022 - 2034
- 8.1.19.1 Middle East Battery Pack & High Voltage Component Market Size
- 8.1.19.2 Middle East Motor Market Size
- 8.1.19.3 Middle East Brake Market Size
- 8.1.19.4 Middle East Wheel & Suspension Market Size
- 8.1.19.5 Middle East Body & Chassis Market Size
- 8.1.19.6 Middle East Others Market Size
-
8.1.20 Middle East Electric Vehicle Volume Market Sales by Component 2022 - 2034
- 8.1.20.1 Middle East Battery Pack & High Voltage Component Sales Volume
- 8.1.20.2 Middle East Motor Sales Volume
- 8.1.20.3 Middle East Brake Sales Volume
- 8.1.20.4 Middle East Wheel & Suspension Sales Volume
- 8.1.20.5 Middle East Body & Chassis Sales Volume
- 8.1.20.6 Middle East Others Sales Volume
-
8.1.21 Middle East Electric Vehicle Market Size by End Use 2022 - 2034
- 8.1.21.1 Middle East Private Use Market Size
- 8.1.21.2 Middle East Commercial Use Market Size
- 8.1.21.3 Middle East Industrial Use Market Size
-
8.1.22 Middle East Electric Vehicle Volume Market Sales by End Use 2022 - 2034
- 8.1.22.1 Middle East Private Use Sales Volume
- 8.1.22.2 Middle East Commercial Use Sales Volume
- 8.1.22.3 Middle East Industrial Use Sales Volume
-
9.1 Africa Electric Vehicle Market Outlook
- 9.1.1 Africa Electric Vehicle Market Size 2022 - 2034
- 9.1.2 Africa Electric Vehicle Volume Market Sales 2022 - 2034
- 9.1.3 Africa Electric Vehicle Market Size By Country 2022 - 2034
- 9.1.4 Africa Electric Vehicle Volume Market Sales By Country 2022 - 2034
-
9.1.5 Africa Electric Vehicle Market Size by Vehicle Type 2022 - 2034
- 9.1.5.1 Africa Two Wheeler Market Size
- 9.1.5.2 Africa Passenger Vehicle Market Size
- 9.1.5.3 Africa Commercial Vehicle Market Size
-
9.1.6 Africa Electric Vehicle Volume Market Sales by Vehicle Type 2022 - 2034
- 9.1.6.1 Africa Two Wheeler Sales Volume
- 9.1.6.2 Africa Passenger Vehicle Sales Volume
- 9.1.6.3 Africa Commercial Vehicle Sales Volume
-
9.1.7 Africa Electric Vehicle Market Size by Propulsion 2022 - 2034
- 9.1.7.1 Africa Battery Electric Vehicle (BEV) Market Size
- 9.1.7.2 Africa Hybrid Electric Vehicle ( HEV) Market Size
-
9.1.8 Africa Electric Vehicle Volume Market Sales by Propulsion 2022 - 2034
- 9.1.8.1 Africa Battery Electric Vehicle (BEV) Sales Volume
- 9.1.8.2 Africa Hybrid Electric Vehicle ( HEV) Sales Volume
-
9.1.9 Africa Electric Vehicle Market Size by Vehicle Class 2022 - 2034
- 9.1.9.1 Africa Low Priced Market Size
- 9.1.9.2 Africa Mid-priced Market Size
- 9.1.9.3 Africa Luxury Market Size
-
9.1.10 Africa Electric Vehicle Volume Market Sales by Vehicle Class 2022 - 2034
- 9.1.10.1 Africa Low Priced Sales Volume
- 9.1.10.2 Africa Mid-priced Sales Volume
- 9.1.10.3 Africa Luxury Sales Volume
-
9.1.11 Africa Electric Vehicle Market Size by Top Speed 2022 - 2034
- 9.1.11.1 Africa <125 MPH Market Size
- 9.1.11.2 Africa >125 MPH Market Size
-
9.1.12 Africa Electric Vehicle Volume Market Sales by Top Speed 2022 - 2034
- 9.1.12.1 Africa <125 MPH Sales Volume
- 9.1.12.2 Africa >125 MPH Sales Volume
-
9.1.13 Africa Electric Vehicle Market Size by Vehicle Drive Type 2022 - 2034
- 9.1.13.1 Africa Front-Wheel Drive Market Size
- 9.1.13.2 Africa Rear Wheel Drive Market Size
- 9.1.13.3 Africa All Wheel Drive Market Size
-
9.1.14 Africa Electric Vehicle Volume Market Sales by Vehicle Drive Type 2022 - 2034
- 9.1.14.1 Africa Front-Wheel Drive Sales Volume
- 9.1.14.2 Africa Rear Wheel Drive Sales Volume
- 9.1.14.3 Africa All Wheel Drive Sales Volume
-
9.1.15 Africa Electric Vehicle Market Size by EV Charging Point Type 2022 - 2034
- 9.1.15.1 Africa Normal Charging Market Size
- 9.1.15.2 Africa Super Charging Market Size
- 9.1.15.3 Africa Inductive Charging Market Size
-
9.1.16 Africa Electric Vehicle Volume Market Sales by EV Charging Point Type 2022 - 2034
- 9.1.16.1 Africa Normal Charging Sales Volume
- 9.1.16.2 Africa Super Charging Sales Volume
- 9.1.16.3 Africa Inductive Charging Sales Volume
-
9.1.17 Africa Electric Vehicle Market Size by Vehicle Connectivity 2022 - 2034
- 9.1.17.1 Africa V2B Market Size
- 9.1.17.2 Africa Vehicle to Grid Market Size
- 9.1.17.3 Africa Vehicle to Vehicle Market Size
-
9.1.18 Africa Electric Vehicle Volume Market Sales by Vehicle Connectivity 2022 - 2034
- 9.1.18.1 Africa V2B Sales Volume
- 9.1.18.2 Africa Vehicle to Grid Sales Volume
- 9.1.18.3 Africa Vehicle to Vehicle Sales Volume
-
9.1.19 Africa Electric Vehicle Market Size by Component 2022 - 2034
- 9.1.19.1 Africa Battery Pack & High Voltage Component Market Size
- 9.1.19.2 Africa Motor Market Size
- 9.1.19.3 Africa Brake Market Size
- 9.1.19.4 Africa Wheel & Suspension Market Size
- 9.1.19.5 Africa Body & Chassis Market Size
- 9.1.19.6 Africa Others Market Size
-
9.1.20 Africa Electric Vehicle Volume Market Sales by Component 2022 - 2034
- 9.1.20.1 Africa Battery Pack & High Voltage Component Sales Volume
- 9.1.20.2 Africa Motor Sales Volume
- 9.1.20.3 Africa Brake Sales Volume
- 9.1.20.4 Africa Wheel & Suspension Sales Volume
- 9.1.20.5 Africa Body & Chassis Sales Volume
- 9.1.20.6 Africa Others Sales Volume
-
9.1.21 Africa Electric Vehicle Market Size by End Use 2022 - 2034
- 9.1.21.1 Africa Private Use Market Size
- 9.1.21.2 Africa Commercial Use Market Size
- 9.1.21.3 Africa Industrial Use Market Size
-
9.1.22 Africa Electric Vehicle Volume Market Sales by End Use 2022 - 2034
- 9.1.22.1 Africa Private Use Sales Volume
- 9.1.22.2 Africa Commercial Use Sales Volume
- 9.1.22.3 Africa Industrial Use Sales Volume
-
10.1 Top Competitors Analysis
-
10.1.1 Global Electric Vehicle Market Revenue and Share by Key Players
(Subject to Data Availability (Private Players))
- 10.1.2 Global Electric Vehicle Market Volume and Share by Key Players
- 10.1.3 Top Players Ranking 2024
- 10.1.4 New Product Launch Analysis
- 10.1.5 Industry Mergers and Acquisition Analysis
-
-
10.2 Company Profile (Data Subject to Availability) Sample Format
-
10.2.1 BYD
Data Subject to Availability as we consider Top competitors and their market share will be delivered.
- 10.2.1.1 Company Basic Information, Manufacturing Base, Sales Area, and Competitors
- 10.2.1.2 Business Overview
- 10.2.1.3 Financials (Subject to data availability)
- 10.2.1.4 R&D Investment (Subject to data availability)
- 10.2.1.5 Product Types Specification
- 10.2.1.6 Business Strategy
- 10.2.1.7 Recent Developments
- 10.2.1.8 Management Change
- 10.2.1.9 S.W.O.T Analysis
-
10.2.2 Tesla
Data Subject to Availability as we consider Top competitors and their market share will be delivered.
- 10.2.2.1 Company Basic Information, Manufacturing Base, Sales Area, and Competitors
- 10.2.2.2 Business Overview
- 10.2.2.3 Financials (Subject to data availability)
- 10.2.2.4 R&D Investment (Subject to data availability)
- 10.2.2.5 Product Types Specification
- 10.2.2.6 Business Strategy
- 10.2.2.7 Recent Developments
- 10.2.2.8 Management Change
- 10.2.2.9 S.W.O.T Analysis
-
10.2.3 Hyundai Motor Group
Data Subject to Availability as we consider Top competitors and their market share will be delivered.
- 10.2.3.1 Company Basic Information, Manufacturing Base, Sales Area, and Competitors
- 10.2.3.2 Business Overview
- 10.2.3.3 Financials (Subject to data availability)
- 10.2.3.4 R&D Investment (Subject to data availability)
- 10.2.3.5 Product Types Specification
- 10.2.3.6 Business Strategy
- 10.2.3.7 Recent Developments
- 10.2.3.8 Management Change
- 10.2.3.9 S.W.O.T Analysis
-
10.2.4 General Motors
Data Subject to Availability as we consider Top competitors and their market share will be delivered.
- 10.2.4.1 Company Basic Information, Manufacturing Base, Sales Area, and Competitors
- 10.2.4.2 Business Overview
- 10.2.4.3 Financials (Subject to data availability)
- 10.2.4.4 R&D Investment (Subject to data availability)
- 10.2.4.5 Product Types Specification
- 10.2.4.6 Business Strategy
- 10.2.4.7 Recent Developments
- 10.2.4.8 Management Change
- 10.2.4.9 S.W.O.T Analysis
-
10.2.5 Volkswagen
Data Subject to Availability as we consider Top competitors and their market share will be delivered.
- 10.2.5.1 Company Basic Information, Manufacturing Base, Sales Area, and Competitors
- 10.2.5.2 Business Overview
- 10.2.5.3 Financials (Subject to data availability)
- 10.2.5.4 R&D Investment (Subject to data availability)
- 10.2.5.5 Product Types Specification
- 10.2.5.6 Business Strategy
- 10.2.5.7 Recent Developments
- 10.2.5.8 Management Change
- 10.2.5.9 S.W.O.T Analysis
-
10.2.6 Renault
Data Subject to Availability as we consider Top competitors and their market share will be delivered.
- 10.2.6.1 Company Basic Information, Manufacturing Base, Sales Area, and Competitors
- 10.2.6.2 Business Overview
- 10.2.6.3 Financials (Subject to data availability)
- 10.2.6.4 R&D Investment (Subject to data availability)
- 10.2.6.5 Product Types Specification
- 10.2.6.6 Business Strategy
- 10.2.6.7 Recent Developments
- 10.2.6.8 Management Change
- 10.2.6.9 S.W.O.T Analysis
-
- 11.1 Market Drivers
- 11.2 Market Restraints
- 11.3 Market Trends
- 11.4 Market Opportunity
- 11.5 Technological Road Map (Subject to Data Availability)
- 11.6 Product Life Cycle (Subject to Data Availability)
-
11.7 Customer and Buyer Behavior Analysis
- 11.7.1 Consumer Demographics and Target Audience Assessment
- 11.7.2 Consumer Purchase Behavior and Demand Assessment
- 11.7.3 Consumer Pricing Dynamics and Affordability Assessment
- 11.7.4 Digital Consumer Engagement and Online Adoption Analysis
- 11.7.5 Future Consumption Trends and Demand Evolution Analysis
- 11.7.6 Enterprise Procurement & Purchasing Behavior Analysis
- 11.7.7 Buyer Decision-Making & Purchase Influence Assessment
- 11.7.8 Customer Expectations & Service Experience Evaluation
- 11.7.9 Vendor Selection & Supplier Preference Analysis
- 11.7.10 Customer Retention & Loyalty Strategy Assessment
- 11.7.11 Pricing Sensitivity & Value Perception Analysis
- 11.7.12 Customer Segmentation & Demand Pattern Analysis
- 11.7.13 Relationship Management & Strategic Partnership Trends
- 11.8 Market Attractiveness Analysis
-
11.9 PESTEL Analysis
- 11.9.1 Political Factors
- 11.9.2 Economic Factors
- 11.9.3 Social Factors
- 11.9.4 Technological Factors
- 11.9.5 Legal Factors
- 11.9.6 Environmental Factors
-
11.10 Industrial Chain Analysis (Subject to Data Availability)
- 11.10.1 Industry Chain Analysis
- 11.10.2 Manufacturing Cost Analysis
-
11.10.3 Supply Side Analysis
- 11.10.3.1 Raw Material Analysis
- 11.10.3.2 Raw Material Procurement Analysis
- 11.10.3.3 Raw Material Price Trend Analysis
-
11.11 Porter’s Five Forces Analysis
- 11.11.1 Bargaining Power of Suppliers
- 11.11.2 Bargaining Power of Buyers
- 11.11.3 Threat of New Entrants
- 11.11.4 Threat of Substitutes
- 11.11.5 Degree of Competition
- 11.12 Patent Analysis (Subject to Data Availability)
- 11.13 ESG Analysis
-
12.1 Two Wheeler
- 12.1.1 Global Electric Vehicle Revenue Market Size and Share by Two Wheeler 2022 - 2034
- 12.1.2 Global Electric Vehicle Volume Market Sales by Two Wheeler 2022 - 2034
-
12.2 Passenger Vehicle
- 12.2.1 Global Electric Vehicle Revenue Market Size and Share by Passenger Vehicle 2022 - 2034
- 12.2.2 Global Electric Vehicle Volume Market Sales by Passenger Vehicle 2022 - 2034
-
12.3 Commercial Vehicle
- 12.3.1 Global Electric Vehicle Revenue Market Size and Share by Commercial Vehicle 2022 - 2034
- 12.3.2 Global Electric Vehicle Volume Market Sales by Commercial Vehicle 2022 - 2034
-
13.1 Battery Electric Vehicle (BEV)
- 13.1.1 Global Electric Vehicle Revenue Market Size and Share by Battery Electric Vehicle (BEV) 2022 - 2034
- 13.1.2 Global Electric Vehicle Volume Market Sales by Battery Electric Vehicle (BEV) 2022 - 2034
-
13.2 Hybrid Electric Vehicle ( HEV)
- 13.2.1 Global Electric Vehicle Revenue Market Size and Share by Hybrid Electric Vehicle ( HEV) 2022 - 2034
- 13.2.2 Global Electric Vehicle Volume Market Sales by Hybrid Electric Vehicle ( HEV) 2022 - 2034
-
14.1 Low Priced
- 14.1.1 Global Electric Vehicle Revenue Market Size and Share by Low Priced 2022 - 2034
- 14.1.2 Global Electric Vehicle Volume Market Sales by Low Priced 2022 - 2034
-
14.2 Mid-priced
- 14.2.1 Global Electric Vehicle Revenue Market Size and Share by Mid-priced 2022 - 2034
- 14.2.2 Global Electric Vehicle Volume Market Sales by Mid-priced 2022 - 2034
-
14.3 Luxury
- 14.3.1 Global Electric Vehicle Revenue Market Size and Share by Luxury 2022 - 2034
- 14.3.2 Global Electric Vehicle Volume Market Sales by Luxury 2022 - 2034
-
15.1 <125 MPH
- 15.1.1 Global Electric Vehicle Revenue Market Size and Share by <125 MPH 2022 - 2034
- 15.1.2 Global Electric Vehicle Volume Market Sales by <125 MPH 2022 - 2034
-
15.2 >125 MPH
- 15.2.1 Global Electric Vehicle Revenue Market Size and Share by >125 MPH 2022 - 2034
- 15.2.2 Global Electric Vehicle Volume Market Sales by >125 MPH 2022 - 2034
-
16.1 Front-Wheel Drive
- 16.1.1 Global Electric Vehicle Revenue Market Size and Share by Front-Wheel Drive 2022 - 2034
- 16.1.2 Global Electric Vehicle Volume Market Sales by Front-Wheel Drive 2022 - 2034
-
16.2 Rear Wheel Drive
- 16.2.1 Global Electric Vehicle Revenue Market Size and Share by Rear Wheel Drive 2022 - 2034
- 16.2.2 Global Electric Vehicle Volume Market Sales by Rear Wheel Drive 2022 - 2034
-
16.3 All Wheel Drive
- 16.3.1 Global Electric Vehicle Revenue Market Size and Share by All Wheel Drive 2022 - 2034
- 16.3.2 Global Electric Vehicle Volume Market Sales by All Wheel Drive 2022 - 2034
-
17.1 Normal Charging
- 17.1.1 Global Electric Vehicle Revenue Market Size and Share by Normal Charging 2022 - 2034
- 17.1.2 Global Electric Vehicle Volume Market Sales by Normal Charging 2022 - 2034
-
17.2 Super Charging
- 17.2.1 Global Electric Vehicle Revenue Market Size and Share by Super Charging 2022 - 2034
- 17.2.2 Global Electric Vehicle Volume Market Sales by Super Charging 2022 - 2034
-
17.3 Inductive Charging
- 17.3.1 Global Electric Vehicle Revenue Market Size and Share by Inductive Charging 2022 - 2034
- 17.3.2 Global Electric Vehicle Volume Market Sales by Inductive Charging 2022 - 2034
-
18.1 V2B
- 18.1.1 Global Electric Vehicle Revenue Market Size and Share by V2B 2022 - 2034
- 18.1.2 Global Electric Vehicle Volume Market Sales by V2B 2022 - 2034
-
18.2 Vehicle to Grid
- 18.2.1 Global Electric Vehicle Revenue Market Size and Share by Vehicle to Grid 2022 - 2034
- 18.2.2 Global Electric Vehicle Volume Market Sales by Vehicle to Grid 2022 - 2034
-
18.3 Vehicle to Vehicle
- 18.3.1 Global Electric Vehicle Revenue Market Size and Share by Vehicle to Vehicle 2022 - 2034
- 18.3.2 Global Electric Vehicle Volume Market Sales by Vehicle to Vehicle 2022 - 2034
-
19.1 Battery Pack & High Voltage Component
- 19.1.1 Global Electric Vehicle Revenue Market Size and Share by Battery Pack & High Voltage Component 2022 - 2034
- 19.1.2 Global Electric Vehicle Volume Market Sales by Battery Pack & High Voltage Component 2022 - 2034
-
19.2 Motor
- 19.2.1 Global Electric Vehicle Revenue Market Size and Share by Motor 2022 - 2034
- 19.2.2 Global Electric Vehicle Volume Market Sales by Motor 2022 - 2034
-
19.3 Brake
- 19.3.1 Global Electric Vehicle Revenue Market Size and Share by Brake 2022 - 2034
- 19.3.2 Global Electric Vehicle Volume Market Sales by Brake 2022 - 2034
-
19.4 Wheel & Suspension
- 19.4.1 Global Electric Vehicle Revenue Market Size and Share by Wheel & Suspension 2022 - 2034
- 19.4.2 Global Electric Vehicle Volume Market Sales by Wheel & Suspension 2022 - 2034
-
19.5 Body & Chassis
- 19.5.1 Global Electric Vehicle Revenue Market Size and Share by Body & Chassis 2022 - 2034
- 19.5.2 Global Electric Vehicle Volume Market Sales by Body & Chassis 2022 - 2034
-
19.6 Others
- 19.6.1 Global Electric Vehicle Revenue Market Size and Share by Others 2022 - 2034
- 19.6.2 Global Electric Vehicle Volume Market Sales by Others 2022 - 2034
-
20.1 Private Use
- 20.1.1 Global Electric Vehicle Revenue Market Size and Share by Private Use 2022 - 2034
- 20.1.2 Global Electric Vehicle Volume Market Sales by Private Use 2022 - 2034
-
20.2 Commercial Use
- 20.2.1 Global Electric Vehicle Revenue Market Size and Share by Commercial Use 2022 - 2034
- 20.2.2 Global Electric Vehicle Volume Market Sales by Commercial Use 2022 - 2034
-
20.3 Industrial Use
- 20.3.1 Global Electric Vehicle Revenue Market Size and Share by Industrial Use 2022 - 2034
- 20.3.2 Global Electric Vehicle Volume Market Sales by Industrial Use 2022 - 2034
- 21.1 Company Gap Assessment Analysis
- 21.2 Product & Service Portfolio Gap Analysis
- 21.3 Demand-Supply Imbalance Analysis
- 21.4 Market Opportunity & Unmet Needs Analysis
- 21.5 Technology Adoption & Digital Transformation Gap Analysis
- 21.6 Operational Efficiency & Process Gap Analysis
- 21.7 Infrastructure & Capacity Gap Analysis
- 21.8 Geographic Coverage & Distribution Gap Analysis
- 21.9 Investment Opportunity & Funding Gap Analysis
- 21.10 Pricing Structure & Margin Gap Analysis
- 21.11 Innovation & R&D Capability Gap Analysis
- 21.12 Policy, Compliance & Regulatory Gap Analysis
- 21.13 Customer Experience & Expectation Gap Analysis
- 21.14 Future Growth Opportunity Gap Analysis
- 21.15 Market Accessibility & Penetration Gap Analysis
- 22.1 Gross Margin Overview and Industry Profitability Trends
- 22.2 Regional Gross Margin Performance Analysis
- 22.3 Supply Chain and Distribution Impact on Gross Margins
- 22.4 Pricing Strategy and Value-Added Margin Assessment
- 22.5 Key Factors Influencing Gross Margin Variability
- 22.6 Future Gross Margin Outlook and Profitability Trends
- 23.1 Key Takeaways
-
23.2 Analyst Point of View
Here the analyst will summarize the content of entire report and will share his view point on the current industry scenario and how the market is expected to perform in the near future. The points shared by the analyst are based on his/her detailed in-depth understanding of the market during the course of this report study. You will be provided exclusive rights to interact with the concerned analyst for unlimited time pre purchase as well as post purchase of the report.
- 23.3 Assumptions and Acronyms
-
24.1 Primary Data Collection
-
24.1.1 Steps for Primary Data Collection
- 24.1.1.1 Identification of KOL
- 24.1.2 Backward Integration
- 24.1.3 Forward Integration
- 24.1.4 How Primary Research Help Us
- 24.1.5 Modes of Primary Research
-
24.1.1 Steps for Primary Data Collection
-
24.2 Secondary Research
- 24.2.1 How Secondary Research Help Us
- 24.2.2 Sources of Secondary Research
-
24.3 Data Validation
- 24.3.1 Data Triangulation
- 24.3.2 Top Down & Bottom Up Approach
- 24.3.3 Cross check KOL Responses with Secondary Data
- 24.4 Data Representation

Athenaeum AI Dashboard
Research Framework · 70:30 Primary:Secondary
Our Proprietary Methodology
Cognitive Market Research employs "The Full Truth™" methodology — a rigorous triangulation process that combines primary research, secondary validation, and expert calibration. Implemented by Sneha Singh and team for the Electric Vehicle Market Analysis Market analysis.
01
Primary Intelligence Gathering
Direct interviews with 50+ industry stakeholders including manufacturers, distributors, end-users, and regulatory bodies across all six regions.
02
Secondary Data Triangulation
Cross-referencing against trade databases, customs records, financial filings, patent databases, and verified industry publications.
03
Expert Validation Protocol
Each data point undergoes validation by minimum two independent domain experts with 15+ years of industry experience.
04
Athenaeum AI Processing
Our proprietary AI platform aggregates, normalizes, and identifies patterns across 10,000+ data points to surface non-obvious insights.
05
Editorial & QA Review
Final review by senior analysts ensures accuracy, coherence, and actionability of all insights and recommendations.
Data Assurance Metrics
Data Points Validated
10,400+
Expert Interviews
54
Countries Covered
39+
Company Profiles
6+
Forecast Accuracy (Historical)
94.2%
Report Pages
250+
Analytical Coverage
Market Sizing
Revenue Forecast
CAGR Analysis
Competitor Benchmarking
SWOT
Porter's Analysis
PESTEL
Value Chain
ESG Analysis
Tariff Impact
Patent Mapping
Tech Trends
To maintain the integrity of our proprietary methodology and protect our elite expert network, specific source disclosures are reserved for full-access partners. Our research framework is anchored by a 70:30 primary-to-secondary ratio, ensuring your strategy is driven by real-time market intelligence rather than recycled, publicly available, or AI-generated data. Every deliverable includes an exhaustive source directory and grants direct analyst access.
Latest News about Electric Vehicle Market
The much-awaited Born Electric line, which includes the BE 6e and XEV 9e electric SUVs, was launched by Mahindra & Mahindra (M&M) This new portfolio, which was introduced on the "INGLO" platform, represents a revolutionary development in Mahindra's approach to electric mobility. The "INGLO" platform, a flat-floor skateboard design intended to increase passenger space by doing away with the center tube, is utilized by both SUVs. High-density battery technology is integrated into the platform to optimize efficiency and range.
With 59 kWh and 79 kWh battery packs, respectively, the BE 6e and XEV 9e can produce up to 282 horsepower. Each charge should provide a range of 450–500 kilometers. Range anxiety is reduced by the fast charging capabilities of both SUVs, which can reach 20–80% battery capacity in just 20 minutes.
Source Link: https://economictimes.indiatimes.com/industry/renewables/mahindra-unveils-be-6e-and-xev-9e-ushering-in-the-born-electric-era/articleshow/115702012.cms?utm_source=contentofinterest&utm_medium=text&utm_campaign=cppst
Morocco Becomes EU’s Top Auto Export Hub, Surpassing China and Japan
Morocco surpassed China and Japan to become the largest vehicle export hub in the European Union. Due to a boom in automobile production and components, Morocco's trade with Europe is expected to increase further. Thanks to its advantageous geographic location and encouraging government subsidies, Morocco has established itself as a crucial manufacturing hub, particularly for European automakers Stellantis and Renault.
With exports accounting for almost 80% of domestic output, Morocco's Tanger Med Port, one of the biggest automotive ports in the world, handled over 578,500 automobiles in 2023. "Morocco is perfect for exporting automobiles because of its close proximity to Europe and effective logistics," stated Taieb Douhlal, Operational Director at Austics Group. By 2025, the government wants to double yearly car production to one million units.
Although Morocco is the top exporter of automobiles, Tunisia and Algeria are also making progress in their industries. Approximately 80% of Tunisia's automobile production is exported to Europe. However, as Mitsubishi Corporation recently relocated its operations from Tunisia to Casablanca, Morocco, competition for investment is changing the face of North Africa.
In 2025, Egypt intends to restart Lada vehicle manufacture at a new facility in Tarbul, with an anticipated yearly production of 50,000–70,000 automobiles as part of its automotive sector overhaul.
Source Link: https://www.autoworldjournal.com/morocco-becomes-eus-top-auto-export/
Evology Charging and CSL Group extend partnership with the implementation of rSIM technology
Electric vehicle (EV) charging operations are being revolutionized, and new benchmarks for dependability and efficiency are being set by Evology Charging and CSL Group through the use of rSIM technology. Continuing to set the standard for sustainable and creative solutions, Evology Charging is a driving force in the UK's EV infrastructure market. Aiming to satisfy the growing demand, Evology is committed to building an easily accessible charging infrastructure. By 2030, forecasts indicate that there will be an additional 9 million electric vehicles on British roads.
Over the years, Evology's collaboration with CSL has been crucial to improving their EV charging operations. But now that CSL's cutting-edge rSIM technology has been integrated, Evology has improved efficiency and dependability throughout its network. By implementing rSIM, EV chargers may now have continuous, reliable connectivity that sets new benchmarks for uptime and operational effectiveness. Important issues with EV charging infrastructure are addressed by the partnership between CSL and Evology Charging. Conventional systems frequently have cybersecurity and resilience issues, which cause downtime and user annoyance. By guaranteeing smooth connectivity across several locales, CSL's multi-network roaming SIMs alleviate these problems and improve operational reliability as well as customer happiness.
The collaboration between CSL and Evology Charging, enabled by rSIM technology, is poised to transform connection norms within the EV charging sector. Along with increasing Evology's competitive advantage, rSIM has cleared the path for a more environmentally friendly and interconnected mobility infrastructure in the future. This collaboration highlights how important connection solutions will be in determining how electric vehicle charging will develop in the future.
Source Link: https://www.automotive-technology.com/news/enhancing-ev-charging-infrastructure-with-rsim-connectivity
NAVEE Teams Up with Target to Debut S40 and V40i Electric Scooters
NAVEE is thrilled to announce that it has partnered with renowned North American retailer Target to bring the much anticipated NAVEE S40 and V40i electric scooters to its shops, marking an important milestone in the company's worldwide expansion journey. With this partnership, NAVEE not only enters the North American retail market but also demonstrates its quick expansion and growing impact within the electric mobility industry.
The NAVEE S40, which recently took home the coveted 2024 Red Dot and iF Design Awards, is set to revolutionize urban commuting. In keeping with its goal to "Navigate the infinite possibilities for the future of mobility," NAVEE is dedicated to offering premium, environmentally responsible transportation options that satisfy the demands of contemporary city people. Inspired by the Tesla Cybertruck, the NAVEE S40 combines cutting-edge technology with potent performance. It is perfect for off-roading as well as urban use because to its 700W motor, 25-mile range, and ShockMasterTM dual swingarm suspension. This elegant, functional, and award-winning scooter is ideal for everyday commuting.
The new V40i's emphasis on use and convenience balances out the S40. It is lighter and easier to use, and it is aimed at women and people who would rather have a less complicated solution. Target's diversified customer base may benefit from the exceptional maneuverability and 25-mile range of the V40i, which makes it a great urban commuting choice. Its small design further enhances its appeal.
Source Link: https://www.automotive-technology.com/news/navee-teams-up-with-target-to-debut-s40-and-v40i-electric-scooters
Evergrandes New Energy Vehicle Unit Surges on a Possible Buyer
Hong Kong-listed shares of the EV unit of the troubled property developer China Evergrande Group surged by as much as 113% on Monday. This marked the first trading day after the company requested a suspension in advance of an announcement. In a late Sunday stock exchange filing, the EV unit revealed that liquidators of its parent company had identified a potential buyer interested in acquiring a 29% stake, with an option to purchase an additional 29.5% stake later. The buyer's identity was not disclosed. Kenny Ng, a securities strategist at Everbright Securities International in Hong Kong, noted that investors were optimistic about the prospect of new ownership. According to the filing, the potential buyer might also offer a line of credit to support the ongoing operations of Evergrande New Energy Vehicle Group.
Source Link: https://www.forbes.com/sites/ywang/2024/05/26/evergrandes-new-energy-vehicle-unit-surges-113-on-a-possible-buyer/?sh=5f06d0905f1c
Hyundai Motor doubles down on EVs as it ramps up investment in Korea
The Hyundai Motor Group intends to increase the manufacturing of electric vehicles and new mobility business in South Korea by investing 68 trillion won ($51 billion) over three years. The 35.5 trillion won investment would go toward building new facilities for electric vehicle (EV) production lines and research and development. This coincides with competitor manufacturers cutting back on their intentions to increase EV production in favor of hybrid vehicles or increasing shareholder dividends and share buybacks. General Motors (GM) prioritized EVs over short-term earnings in 2021 and expected to invest over $35 billion in EV initiatives through 2025. But last year, the US carmaker cut its estimated EV output and postponed the construction of an electric truck factory. On Friday, the New York Auto Show opens, and the industry must make a difficult choice. Although the Japanese carmaker has prioritized growing sales of gas-electric hybrids, Toyota is expanding the number of EVs in its lineup. Regarding the introduction of plug-in hybrid cars, Hyundai will stick to its goals while remaining adaptable. Hyundai anticipates starting EV production in Georgia in October to be eligible for $7,500 in tax credits under the Inflation Reduction Act. The investment plan calls for the renovation of a Kia facility to make compact electric cars (EVs), the commencement of production of "PBV" vehicles in 2025 at a second factory, and the mass production of "ultra-large" Genesis luxury EVs by Hyundai at its Ulsan factory in the first quarter of 2026.
Source Link: https://www.reuters.com/business/autos-transportation/lg-group-invest-744-bln-over-next-5-years-2024-03-27/
Xiaomi takes aim at Tesla in Chinese auto market with $29,870 electric car
The third-largest smartphone vendor in China, Xiaomi, will make its debut in the automotive industry on Thursday when it introduces its electric vehicle (EV). The car will be compared to Porsche's Taycan and Panamera sports car versions and priced under 500,000 RMB ($69,170.64). Lei Jun, the founder and CEO of Xiaomi, achieved his goal of investing $10 billion in the automotive industry with the launch. On the likelihood that Xiaomi's auto initiative will be successful, analysts are split. Some think it's a logical progression for Xiaomi, providing a smoother online experience and gathering additional information. Lei, however, has stated that the SU7 will be "a bit expensive," deviating from the company's reputation as an inexpensive brand. The launch of the SU7 coincides with China's. The SU7 is going on sale at a time when a faltering domestic economy and a pricing war are plaguing China's car industry. Xiaomi is third in terms of cash and cash equivalents, indicating that it has more resources than other EV companies. Xiaomi has an advantage over traditional automakers in smart cockpits, a characteristic that Chinese consumers enjoy, according to analysts, thanks to its experience with smartphones.
Source Link: https://www.reuters.com/business/autos-transportation/xiaomi-set-plunge-into-evs-tricky-time-china-autos-2024-03-27/
Latest Articles about Electric Vehicle Market
The global electric vehicle industry in 2026 is being reshaped by emerging companies driving innovation in battery technology, smart mobility, and sustainable transportation. This article highlights key EV startups and fast-growing manufacturers that are redefining vehicle design, performance, and market competition worldwide.
Sources from Automobile & Transportation Industry
- https://oar-info.ru/about/en?id=138
- https://avnu.org/
- https://clepa.eu/
- https://www.acea.auto/
- https://www.eucar.be/
- https://www.sae.org/
- https://www.vda.de/en
- https://www.oica.net/
- https://covesa.global/
- https://www.jama.or.jp/english/
- https://opensig.org/
- https://www.siam.in/
- https://www.smmt.co.uk/
- https://theicct.org/
- https://www.nhtsa.gov/
- http://www.transportation.gov
- https://heavyindustries.gov.in
- http://www.iea.org
- http://www.epa.gov
- http://www.cargroup.org
- http://www.garc.co.in
- http://nrc.canada.ca
- http://www.nbr.org
- http://www.eia.gov
- http://en.caam.org.cn
- http://www.natrip.in
- http://www.eea.europa.eu
- http://www.nrel.gov
- http://www.epa.gov
- http://www.nhtsa.gov
How We Serve You
Three Pillars of Market Intelligence
We don't just hand over data. We partner with your team across three integrated service lines — each designed to give you decision-grade intelligence on the Electric Vehicle Market Analysis market.
Service 01
Market Survey
B2B
B2C
Structured primary research across both B2B and B2C channels. We design and execute custom surveys targeting manufacturers, distributors, procurement heads, and end-consumers in the electric vehicle market analysis ecosystem — validated by our global panel of 10,000+ industrial respondents.
What's Included
- Buyer intent & sentiment analysis
- Purchase cycle mapping
- Price sensitivity research
- Channel preference profiling
- Competitive perception study
Most Requested
Service 02
Customized Market Data & Reports
Custom
Ready Report
Choose from our ready-to-access 8th Edition report or commission a fully customized dataset tailored to your exact strategic questions. Cross-splits, custom geographies, proprietary segmentation — we build the intelligence asset your board actually needs.
What's Included
- Ready syndicate report (250+ pages)
- Custom data scope & segmentation
- Excel quantitative models
- Board-ready PPT with key findings
- Secure cloud portal access
Service 03
Strategic Consultation
With Survey
With Report
Every survey and every report comes with dedicated analyst consultation. Our senior research team walks your leadership through findings, answers strategic questions in real-time, and helps translate data into your next board presentation or investment thesis.
What's Included
- Dedicated analyst assigned to you
- Live walkthrough of findings
- Strategic Q&A sessions
- Go-to-market recommendations
- NDA-protected engagement
Customize This Report
Tell us the specific segments, regions, or companies you need — and we will tailor the deliverable to your requirements.