Color Matching Cabinet Market Analysis from 2022 to 2034 Containing Market Size, Share along with its CAGR, Forecast and Trends
Top Countries — Revenue
Access the full forecast model.
Country-level data · Company profiles · Editable dataset · Analyst consultation included.
Color Matching Cabinet Market Analysis — Presence
Geographical Analysis
Click countries to exploreRegional and Country Analysis
Global Color Matching Cabinet Market Analysis 2026
| Region / Country | 2021 (A) | 2025 (A) | 2033 (P) | CAGR |
|---|---|---|---|---|
| Global | $ 123.98 Million | $ 157.23 Million | $ 252.88 Million | 6.12% |
| North America | $ 57.03 Million | $ 71.47 Million | $ 113.72 Million | 5.979% |
| United States | $ 41.63 Million | $ 51.3 Million | $ 79.26 Million | 5.588% |
| Canada | $ 13.69 Million | $ 17.88 Million | $ 30.61 Million | 6.95% |
| Mexico | $ 1.71 Million | $ 2.29 Million | $ 3.86 Million | 6.765% |
| Europe | $ 6.2 Million | $ 7.71 Million | $ 12.18 Million | 5.883% |
| United Kingdom | $ 1.92 Million | $ 2.48 Million | $ 4.17 Million | 6.723% |
| France | $ 0.93 Million | $ 1.14 Million | $ 1.74 Million | 5.432% |
| Germany | $ 1.18 Million | $ 1.49 Million | $ 2.41 Million | 6.186% |
| Italy | $ 0.62 Million | $ 0.74 Million | $ 1.1 Million | 5.054% |
| Russia | $ 0.31 Million | $ 0.38 Million | $ 0.55 Million | 4.885% |
| Spain | $ 0.37 Million | $ 0.44 Million | $ 0.68 Million | 5.473% |
| Sweden | $ 0.19 Million | $ 0.23 Million | $ 0.33 Million | 4.728% |
| Denmark | $ 0.25 Million | $ 0.3 Million | $ 0.45 Million | 5.086% |
| Switzerland | $ 0.13 Million | $ 0.16 Million | $ 0.25 Million | 5.614% |
| Luxembourg | $ 0.11 Million | $ 0.13 Million | $ 0.21 Million | 5.523% |
| Rest of Europe | $ 0.2 Million | $ 0.22 Million | $ 0.3 Million | 4.106% |
| Asia Pacific | $ 21.08 Million | $ 27.52 Million | $ 46.19 Million | 6.689% |
| China | $ 5.27 Million | $ 6.89 Million | $ 11.86 Million | 7.029% |
| Japan | $ 3.58 Million | $ 4.61 Million | $ 7.18 Million | 5.694% |
| South Korea | $ 1.12 Million | $ 1.43 Million | $ 2.36 Million | 6.44% |
| India | $ 3.79 Million | $ 5.14 Million | $ 9.17 Million | 7.494% |
| Australia | $ 0.63 Million | $ 0.79 Million | $ 1.27 Million | 6.215% |
| Singapore | $ 2.74 Million | $ 3.43 Million | $ 5.64 Million | 6.402% |
| Taiwan | $ 1.1 Million | $ 1.38 Million | $ 2.23 Million | 6.175% |
| South East Asia | $ 1.71 Million | $ 2.31 Million | $ 3.92 Million | 6.815% |
| Rest of APAC | $ 1.14 Million | $ 1.53 Million | $ 2.56 Million | 6.633% |
| South America | $ 9.92 Million | $ 12.26 Million | $ 19.49 Million | 5.972% |
| Brazil | $ 3.57 Million | $ 4.46 Million | $ 7.26 Million | 6.271% |
| Argentina | $ 1.7 Million | $ 2.11 Million | $ 3.41 Million | 6.164% |
| Colombia | $ 1.98 Million | $ 2.48 Million | $ 4 Million | 6.177% |
| Peru | $ 0.49 Million | $ 0.59 Million | $ 0.91 Million | 5.459% |
| Chile | $ 0.78 Million | $ 0.95 Million | $ 1.48 Million | 5.724% |
| Rest of South America | $ 1.4 Million | $ 1.67 Million | $ 2.44 Million | 4.892% |
| Middle East | $ 10.04 Million | $ 13.04 Million | $ 22.15 Million | 6.848% |
| Saudi Arabia | $ 4.71 Million | $ 6.19 Million | $ 10.71 Million | 7.109% |
| Turkey | $ 1.11 Million | $ 1.4 Million | $ 2.32 Million | 6.581% |
| UAE | $ 1.03 Million | $ 1.36 Million | $ 2.41 Million | 7.43% |
| Egypt | $ 0.6 Million | $ 0.77 Million | $ 1.28 Million | 6.536% |
| Qatar | $ 1.61 Million | $ 2.11 Million | $ 3.61 Million | 6.981% |
| Rest of Middle East | $ 0.99 Million | $ 1.22 Million | $ 1.81 Million | 5.016% |
| Africa | $ 19.71 Million | $ 25.24 Million | $ 39.14 Million | 5.637% |
| East Africa | xxxx | xxxx | xxxx | xxxx |
| West Africa | xxxx | xxxx | xxxx | xxxx |
| North Africa | xxxx | xxxx | xxxx | xxxx |
| South Africa | $ 2.39 Million | $ 3.1 Million | $ 4.94 Million | 5.994% |
A = Actual · E = Estimated · P = Projected · 🔒 Locked values require full access. Click headers to sort.
Unlock full regional dataset →Segmentation Analysis
Type breakdown · Illustrative 2025 shares shown free · Full-period forecast in paid report.
Disclaimer: The charts and graphs are for illustrative purposes only and do not represent actual market values. To access accurate quantitative data, please request a paid report or request free sample.
To learn more about market share and segmentation, request the free sample pages.
Competitor Analysis
Our report features detailed profiles of key competitors in the Color Matching Cabinet Market Analysis market, covering financials and forecasts (2021–2033), revenue, margins, market share, and strategic initiatives such as M&A, partnerships, and product pipelines. Each profile includes a SWOT analysis, along with insights into supply chain resilience and sustainability (ESG) efforts. Full competitive intelligence and customized data options are available in the paid report.
| Top Companies (In no particular order) | 2022 (A) | 2023 (A) | 2024 (A) | 2025 (A) |
|---|---|---|---|---|
| Konica Minolta Sensing AmericasInc.US | ••• | ••• | ••• | ••• |
| HardwareSourceInc.US | ••• | ••• | ••• | ••• |
| Grainger Industrial SupplyUS | ••• | ••• | ••• | ••• |
| PCE InstrumentsGermany | ••• | ••• | ••• | ••• |
| Asian Test EquipmentsIndia | ••• | ••• | ••• | ••• |
| Paramount InstrumentsIndia | ••• | ••• | ••• | ••• |
| Texcare InstrumentsIndia | ••• | ••• | ••• | ••• |
| Amith Garment ServicesIndia | ••• | ••• | ••• | ••• |
| PRESTO STANTEST PRIVATE LIMITEDIndia | ••• | ••• | ••• | ••• |
| Tex Lab IndustriesIndia | ••• | ••• | ••• | ••• |
| Sumit Sales CompanyIndia | ••• | ••• | ••• | ••• |
| Raj Scientific CompanyIndia | ••• | ••• | ••• | ••• |
| Jay Instruments Systems Pvt. LtdIndia | ••• | ••• | ••• | ••• |
| Rishikesh Electromatic Pvt. Ltd.India | ••• | ••• | ••• | ••• |
| Deep EngineeringIndia | ••• | ••• | ••• | ••• |
We Provide Regional Breakdown of this Companies and Company specific to any Country, Region, Product/ service as well. We cover market share analysis for publicly listed companies as well as privately held companies, subject to data availability.
Request company profile for validation →Report Scope & Analysis
Executive Summary of Color Matching Cabinet Market
The global Color Matching Cabinet market is on a significant growth trajectory, projected to expand from $123.979 million in 2021 to $252.879 million by 2033, registering a compound annual growth rate (CAGR) of 6.12%. This expansion is primarily driven by the escalating need for stringent quality control and color consistency across a multitude of industries, including textiles, automotive, paints, plastics, and printing. The market's evolution is marked by a technological shift towards energy-efficient LED light sources and the integration of smart features, connecting cabinets with digital color management systems. While North America currently holds the largest market share due to its established manufacturing base, the Asia-Pacific region is emerging as the fastest-growing market, fueled by rapid industrialization and increasing quality standards. The consistent demand for accurate color assessment to meet consumer expectations and regulatory requirements underpins the market's stable and positive outlook.
Key strategic insights from our comprehensive analysis reveal:
- The Asia-Pacific region represents the most significant growth opportunity, with the highest regional CAGR of 6.689%, driven by booming manufacturing sectors in countries like China and India.
- Technological advancement, particularly the transition from traditional fluorescent lighting to versatile, energy-efficient LED technology and software integration, is a critical trend shaping market dynamics and product development.
- North America remains the dominant market force, accounting for a substantial portion of global revenue, supported by stringent quality standards in its advanced automotive, aerospace, and consumer goods industries.
Strategic Recommendations for Manufacturers
Manufacturers should prioritize innovation in LED technology to offer more accurate, stable, and energy-efficient lighting solutions. Expanding market presence in the high-growth Asia-Pacific region through strategic partnerships and localized product offerings is crucial. Developing scalable, cost-effective models can help penetrate the SME segment. Furthermore, enhancing software integration capabilities to create smart, connected cabinets that fit seamlessly into Industry 4.0 workflows will be a key differentiator, providing added value through data logging, remote monitoring, and improved analytical functions.
The global Machinery and Equipment industry, a cornerstone of industrialization and construction, is rapidly transforming under Industry 4.0 with automation, connectivity, and data-driven efficiency. Growth is fueled by urbanization, infrastructure projects, and rising adoption of AI and robotics to boost productivity. However, high capital and maintenance costs, along with a shortage of skilled labor, remain key challenges. Opportunities lie in digitalization and IoT for predictive maintenance, advanced robotics for streamlined operations, emission control technologies for sustainability, and strong government investments supporting infrastructure and manufacturing growth.
Analyst Conclusion
As per Cognitive's Research Analyst, Color Matching Cabinet are essential tools for visual color assessment under standardized lighting conditions. They play an essential role in ensuring quality and consistency across various manufacturing processes.
Looking at the Historical Growth The global market expanded from $123.979 million in 2021 to an estimated $166.85 million in 2026 due to the escalating need for stringent quality control and color consistency across industries. Regionally, North America grew from $57.03 million in 2021 to $75.74 million in 2026, while Asia Pacific progressed from $21.076 million to $29.36 million over the same period.
Currently in 2026, North America holds a commanding 45.41% of the global market, driven by demanding industries like automotive and aerospace with non-negotiable color quality standards. Industrial manufacturing applications remain the primary consumer of Color Matching Cabinet. Additionally Middle East is set to be the fastest-growing region, exhibiting the highest CAGR of 6.848%, fueled by large-scale construction projects and economic diversification initiatives.
The market is witnessing a definitive shift towards energy-efficient LED light sources, driven by their lower energy consumption and precise color replication capabilities. Ongoing innovation in digital workflow integration is also leading, focusing on the seamless capture, analysis, and communication of color data.
In the future, The global Color Matching Cabinet market will reach to $252.879 million by 2033, expanding at a compound annual growth rate of 6.12% from 2021, primarily driven by stringent assessment needs and evolving market demands. Ongoing innovation in smart features and digital color management systems and the strong trend towards meeting consumer expectations and regulatory requirements for accurate color assessment will also contribute significantly.

Pratik Shirsath serves as a Research Analyst at Cognitive Market Research & Consulting, where he focuses on the Machinery & Equipment, Manufacturing, and Construction sectors. His work centers on delivering strategic market intelligence that helps organizations understand evolving industry dynamics, technological advancements, and emerging growth opportunities across industrial and infrastructure markets. By combining primary research with extensive secondary analysis, he develops data-driven insights that support informed business decision-making.
Drawing on experience across industrial value chains, Pratik conducts market assessments, competitive evaluations, trend analysis, stakeholder research, and opportunity mapping for clients operating in complex engineering and manufacturing environments. He regularly engages with manufacturers, equipment suppliers, industry experts, contractors, distributors, and other market participants to gather firsthand perspectives while validating findings through comprehensive secondary research. His ability to interpret technical and commercial data enables organizations to gain a clearer understanding of market conditions, investment trends, and competitive developments.
As part of his role, Pratik contributes to syndicated research studies, custom consulting projects, and strategic market reports covering industrial machinery, factory automation, manufacturing technologies, construction equipment, building materials, and infrastructure-related markets. His analytical approach helps clients evaluate market potential, identify expansion opportunities, assess competitive positioning, and navigate industry challenges with greater confidence.
Known for transforming complex datasets and technical information into actionable business intelligence, Pratik supports organizations in developing effective growth strategies and operational plans. His continued focus on industrial innovation, automation technologies, sustainable manufacturing practices, and evolving construction trends enables him to deliver valuable research that helps businesses adapt to changing market environments and achieve long-term success.
Purchase & Support
What you get, what it costs, and how we stand behind it
Every licence includes two years of analyst access, not just a document. Below: the decisions this research supports, what is included, what is charged separately, and the checks every figure passes before release.
What our consultation helps you decide
If you are deciding…
- Whether to enter or expand in a market
- Where to invest across the portfolio
- Which customer groups to target
- Where to direct product development
- How to position against competitors
- How your performance compares to the market
- Whether to acquire, partner or divest
- Whether to invest or fund
- How to plan budgets and targets
- Which route to market to build
- How to assess supply and sourcing risk
These are the decisions clients bring us most often — but they are not the limit. Most engagements surface questions the data alone does not answer, and that is where the consultation does the work. Tell us what you are deciding, and our analyst will tell you what the research can support.
Included in your purchase
A licence is a two-year relationship, not a one-time download. Everything below is included at no additional cost.
Access & formats
- Multi-format delivery
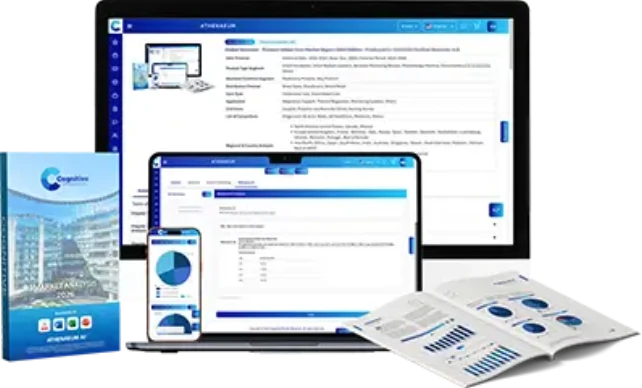
- Cloud/HTML with master and team access, PDF, Excel data models, board-ready PPT, and the Athenaeum AI consultant.
- Interactive dashboard
- Toggle the dataset across global currencies and languages in real time.
- Portfolio-level insight
- Three-year country-level market sizing across your entire product range, not a single line.
Updates & editions
- 8 quarterly refreshes
- Complimentary data updates every quarter for two years, so your figures track the market rather than the publication date.
- Next two annual editions
- The following two yearly editions are added to your account automatically.
- Dated at source
- Every deliverable carries a visible “data updated” date so recency is never in question.
Advisory & support
- 6 hours analyst consultation
- One-to-one time with the lead analyst for Q&A, walkthroughs, or to join an internal executive discussion as an independent adviser.
- Two-year strategic advisory
- Continuing support on assumptions, methodology and evolving requirements for the full licence period.
- 24/7 client support
- Round-the-clock account support for ad-hoc queries and new requests.
How delivery works
From first enquiry to dispatch, with a named analyst attached at every stage. Standard delivery is 5–7 business days from scope confirmation.
Before you buy
Complimentary preview. The full data structure and table of contents, so you can judge scope before committing.
Scope tailored to your question. Share your use case and problem statement and we shape the research around it.
Modular purchasing. Buy specific chapters, sections or graphs at nominal rates without the full dataset.
Confidentiality from first contact
Your proprietary requirements and personal information are safeguarded under GDPR (EU/UK), CCPA (USA) and the DPDP Act (India).
All project parameters are bound by a non-disclosure agreement from your first enquiry — not from the point of purchase.
Delivery execution
- 01Scope confirmationReview the preview with your dedicated analyst to agree variables, structure and formats.
- 02Extraction & customisationWe isolate the precise segments and parameters you need from the core database.
- 03Current-market validationFigures are refreshed and cross-checked against current-quarter market conditions.
- 04Expert QASenior specialists run qualitative checks and resolve overlaps and discrepancies.
- 05Dispatch & walkthroughDelivered in 5–7 business days, followed by an analyst-led walkthrough and Q&A.
Scope, timeline and price are confirmed in writing before any work starts. Customised datasets follow the same validation method and quality review as the standard report.
Available at additional cost
Outside the standard licence, but available on request. Scope and price are confirmed in writing before any work begins.
How we assure quality
Before any dataset is released, it passes a five-stage review carried out by senior analysts and independent industry specialists.
- Senior analyst reviewEvery headline figure — market size, forecast, growth rate — is checked by a senior analyst before publication.
- Independent expert verificationEach data point is reviewed by at least two industry specialists with 15+ years in the category.
- Arithmetic and reconciliationCountry and regional figures are reconciled to their totals and cross-checked against observable market conditions.
- Divergence resolutionWhere sources conflict, we trace the cause rather than averaging it away, and record the basis for the figure we publish.
- Dated releaseEach deliverable ships with an explicit data-updated date and the edition it belongs to.
By combining statistical validation with qualitative vetting by practitioners, we release figures that are structurally sound and ready to carry into a board paper, an investment memo or a regulatory filing.
Need something outside this scope? Share your use case and we will confirm feasibility, timeline and price in writing before work starts.
Frequently Asked Questions
★ Reviews
Rate this report
Color Matching Cabinet Market Analysis — Table of Contents
- This is just a redacted sample pages of the actual deliverable report and only for representative purposes
- Charts/Graphs/Numbers/data are only for Representative purposes and do not depict actual statistics.
- The table of Contents differs according to the user License selection. Current Displayed TOC is for the Corporate User License Report Edition. TOC Customization options: Add or Remove section/s Or chapter/s from the report.
- Specific Tables, Graphs, Sections, and Chapters can be ordered at a discounted price.
- If applicable; On Request Volume Data will also be provided (at an Additional Cost).
Report Scope
| Type | Rocker Switch Color Matching Cabinet, Feather Touch Switch Color Matching Cabinet |
|---|---|
| Application | Packaging, Consumer Goods, Building, Construction |
| List of Competitors | Konica Minolta Sensing AmericasInc.US, HardwareSourceInc.US, Grainger Industrial SupplyUS, PCE InstrumentsGermany, Asian Test EquipmentsIndia, Paramount InstrumentsIndia, Texcare InstrumentsIndia, Amith Garment ServicesIndia, PRESTO STANTEST PRIVATE LIMITEDIndia, Tex Lab IndustriesIndia, Sumit Sales CompanyIndia, Raj Scientific CompanyIndia, Jay Instruments Systems Pvt. LtdIndia, Rishikesh Electromatic Pvt. Ltd.India, Deep EngineeringIndia |
Chapter 1. Competitor Analysis (Subject to Data Availability (Private Players))
- 1.1 Top Competitors Analysis
- 1.1.1 Global Color Matching Cabinet Market Analysis by Key Players
- 1.1.2 Segment Market Analysis by Key Players
- 1.1.3 Top Players Ranking 2024
- 1.1.4 New Product Launch Analysis
- 1.1.5 Industry Mergers and Acquisition Analysis
- 1.2 Company Profile (Data Subject to Availability) Sample Format
- 1.2.1 Konica Minolta Sensing AmericasInc.US
- 1.2.1.1 Company Basic Information, Manufacturing Base, Sales Area, and Competitors
- 1.2.1.2 Business Overview
- 1.2.1.3 Financials (Subject to data availability)
- 1.2.1.4 R&D Investment (Subject to data availability)
- 1.2.1.5 Product Types Specification
- 1.2.1.6 Business Strategy
- 1.2.1.7 Recent Developments
- 1.2.1.8 Management Change
- 1.2.1.9 S.W.O.T Analysis
- 1.2.2 HardwareSourceInc.US
- 1.2.2.1 Company Basic Information, Manufacturing Base, Sales Area, and Competitors
- 1.2.2.2 Business Overview
- 1.2.2.3 Financials (Subject to data availability)
- 1.2.2.4 R&D Investment (Subject to data availability)
- 1.2.2.5 Product Types Specification
- 1.2.2.6 Business Strategy
- 1.2.2.7 Recent Developments
- 1.2.2.8 Management Change
- 1.2.2.9 S.W.O.T Analysis
- 1.2.3 Grainger Industrial SupplyUS
- 1.2.3.1 Company Basic Information, Manufacturing Base, Sales Area, and Competitors
- 1.2.3.2 Business Overview
- 1.2.3.3 Financials (Subject to data availability)
- 1.2.3.4 R&D Investment (Subject to data availability)
- 1.2.3.5 Product Types Specification
- 1.2.3.6 Business Strategy
- 1.2.3.7 Recent Developments
- 1.2.3.8 Management Change
- 1.2.3.9 S.W.O.T Analysis
- 1.2.4 PCE InstrumentsGermany
- 1.2.4.1 Company Basic Information, Manufacturing Base, Sales Area, and Competitors
- 1.2.4.2 Business Overview
- 1.2.4.3 Financials (Subject to data availability)
- 1.2.4.4 R&D Investment (Subject to data availability)
- 1.2.4.5 Product Types Specification
- 1.2.4.6 Business Strategy
- 1.2.4.7 Recent Developments
- 1.2.4.8 Management Change
- 1.2.4.9 S.W.O.T Analysis
- 1.2.5 Asian Test EquipmentsIndia
- 1.2.5.1 Company Basic Information, Manufacturing Base, Sales Area, and Competitors
- 1.2.5.2 Business Overview
- 1.2.5.3 Financials (Subject to data availability)
- 1.2.5.4 R&D Investment (Subject to data availability)
- 1.2.5.5 Product Types Specification
- 1.2.5.6 Business Strategy
- 1.2.5.7 Recent Developments
- 1.2.5.8 Management Change
- 1.2.5.9 S.W.O.T Analysis
- 1.2.6 Paramount InstrumentsIndia
- 1.2.6.1 Company Basic Information, Manufacturing Base, Sales Area, and Competitors
- 1.2.6.2 Business Overview
- 1.2.6.3 Financials (Subject to data availability)
- 1.2.6.4 R&D Investment (Subject to data availability)
- 1.2.6.5 Product Types Specification
- 1.2.6.6 Business Strategy
- 1.2.6.7 Recent Developments
- 1.2.6.8 Management Change
- 1.2.6.9 S.W.O.T Analysis
- 1.2.7 Texcare InstrumentsIndia
- 1.2.7.1 Company Basic Information, Manufacturing Base, Sales Area, and Competitors
- 1.2.7.2 Business Overview
- 1.2.7.3 Financials (Subject to data availability)
- 1.2.7.4 R&D Investment (Subject to data availability)
- 1.2.7.5 Product Types Specification
- 1.2.7.6 Business Strategy
- 1.2.7.7 Recent Developments
- 1.2.7.8 Management Change
- 1.2.7.9 S.W.O.T Analysis
- 1.2.8 Amith Garment ServicesIndia
- 1.2.8.1 Company Basic Information, Manufacturing Base, Sales Area, and Competitors
- 1.2.8.2 Business Overview
- 1.2.8.3 Financials (Subject to data availability)
- 1.2.8.4 R&D Investment (Subject to data availability)
- 1.2.8.5 Product Types Specification
- 1.2.8.6 Business Strategy
- 1.2.8.7 Recent Developments
- 1.2.8.8 Management Change
- 1.2.8.9 S.W.O.T Analysis
- 1.2.9 PRESTO STANTEST PRIVATE LIMITEDIndia
- 1.2.9.1 Company Basic Information, Manufacturing Base, Sales Area, and Competitors
- 1.2.9.2 Business Overview
- 1.2.9.3 Financials (Subject to data availability)
- 1.2.9.4 R&D Investment (Subject to data availability)
- 1.2.9.5 Product Types Specification
- 1.2.9.6 Business Strategy
- 1.2.9.7 Recent Developments
- 1.2.9.8 Management Change
- 1.2.9.9 S.W.O.T Analysis
- 1.2.10 Tex Lab IndustriesIndia
- 1.2.10.1 Company Basic Information, Manufacturing Base, Sales Area, and Competitors
- 1.2.10.2 Business Overview
- 1.2.10.3 Financials (Subject to data availability)
- 1.2.10.4 R&D Investment (Subject to data availability)
- 1.2.10.5 Product Types Specification
- 1.2.10.6 Business Strategy
- 1.2.10.7 Recent Developments
- 1.2.10.8 Management Change
- 1.2.10.9 S.W.O.T Analysis
- 1.2.11 Sumit Sales CompanyIndia
- 1.2.11.1 Company Basic Information, Manufacturing Base, Sales Area, and Competitors
- 1.2.11.2 Business Overview
- 1.2.11.3 Financials (Subject to data availability)
- 1.2.11.4 R&D Investment (Subject to data availability)
- 1.2.11.5 Product Types Specification
- 1.2.11.6 Business Strategy
- 1.2.11.7 Recent Developments
- 1.2.11.8 Management Change
- 1.2.11.9 S.W.O.T Analysis
- 1.2.12 Raj Scientific CompanyIndia
- 1.2.12.1 Company Basic Information, Manufacturing Base, Sales Area, and Competitors
- 1.2.12.2 Business Overview
- 1.2.12.3 Financials (Subject to data availability)
- 1.2.12.4 R&D Investment (Subject to data availability)
- 1.2.12.5 Product Types Specification
- 1.2.12.6 Business Strategy
- 1.2.12.7 Recent Developments
- 1.2.12.8 Management Change
- 1.2.12.9 S.W.O.T Analysis
- 1.2.13 Jay Instruments Systems Pvt. LtdIndia
- 1.2.13.1 Company Basic Information, Manufacturing Base, Sales Area, and Competitors
- 1.2.13.2 Business Overview
- 1.2.13.3 Financials (Subject to data availability)
- 1.2.13.4 R&D Investment (Subject to data availability)
- 1.2.13.5 Product Types Specification
- 1.2.13.6 Business Strategy
- 1.2.13.7 Recent Developments
- 1.2.13.8 Management Change
- 1.2.13.9 S.W.O.T Analysis
- 1.2.14 Rishikesh Electromatic Pvt. Ltd.India
- 1.2.14.1 Company Basic Information, Manufacturing Base, Sales Area, and Competitors
- 1.2.14.2 Business Overview
- 1.2.14.3 Financials (Subject to data availability)
- 1.2.14.4 R&D Investment (Subject to data availability)
- 1.2.14.5 Product Types Specification
- 1.2.14.6 Business Strategy
- 1.2.14.7 Recent Developments
- 1.2.14.8 Management Change
- 1.2.14.9 S.W.O.T Analysis
- 1.2.15 Deep EngineeringIndia
- 1.2.15.1 Company Basic Information, Manufacturing Base, Sales Area, and Competitors
- 1.2.15.2 Business Overview
- 1.2.15.3 Financials (Subject to data availability)
- 1.2.15.4 R&D Investment (Subject to data availability)
- 1.2.15.5 Product Types Specification
- 1.2.15.6 Business Strategy
- 1.2.15.7 Recent Developments
- 1.2.15.8 Management Change
- 1.2.15.9 S.W.O.T Analysis
- 1.2.1 Konica Minolta Sensing AmericasInc.US
- 1.1 Top Competitors Analysis
Chapter 2. Global Color Matching Cabinet Market Analysis
- 2.1 Global Color Matching Cabinet Market Analysis
- 2.2 Global Color Matching Cabinet Market Analysis by Region
- 2.3 Global Color Matching Cabinet Market Analysis by Type
- 2.4 Global Color Matching Cabinet Market Analysis by Application
- 2.5 Global Color Matching Cabinet Market Analysis by Key Players
Chapter 3. North America Color Matching Cabinet Market Analysis
- 3.1 North America Color Matching Cabinet Market Analysis
- 3.2 North America Color Matching Cabinet Market Analysis by Country
- 3.3 North America Color Matching Cabinet Market Analysis by Type
- 3.4 North America Color Matching Cabinet Market Analysis by Application
- 3.5 North America Color Matching Cabinet Market Analysis by Key Players
Chapter 4. Europe Color Matching Cabinet Market Analysis
- 4.1 Europe Color Matching Cabinet Market Analysis
- 4.2 Europe Color Matching Cabinet Market Analysis by Country
- 4.3 Europe Color Matching Cabinet Market Analysis by Type
- 4.4 Europe Color Matching Cabinet Market Analysis by Application
- 4.5 Europe Color Matching Cabinet Market Analysis by Key Players
Chapter 5. Asia Pacific Color Matching Cabinet Market Analysis
- 5.1 Asia Pacific Color Matching Cabinet Market Analysis
- 5.2 Asia Pacific Color Matching Cabinet Market Analysis by Country
- 5.3 Asia Pacific Color Matching Cabinet Market Analysis by Type
- 5.4 Asia Pacific Color Matching Cabinet Market Analysis by Application
- 5.5 Asia Pacific Color Matching Cabinet Market Analysis by Key Players
Chapter 6. South America Color Matching Cabinet Market Analysis
- 6.1 South America Color Matching Cabinet Market Analysis
- 6.2 South America Color Matching Cabinet Market Analysis by Country
- 6.3 South America Color Matching Cabinet Market Analysis by Type
- 6.4 South America Color Matching Cabinet Market Analysis by Application
- 6.5 South America Color Matching Cabinet Market Analysis by Key Players
Chapter 7. Middle East Color Matching Cabinet Market Analysis
- 7.1 Middle East Color Matching Cabinet Market Analysis
- 7.2 Middle East Color Matching Cabinet Market Analysis by Country
- 7.3 Middle East Color Matching Cabinet Market Analysis by Type
- 7.4 Middle East Color Matching Cabinet Market Analysis by Application
- 7.5 Middle East Color Matching Cabinet Market Analysis by Key Players
Chapter 8. Africa Color Matching Cabinet Market Analysis
- 8.1 Africa Color Matching Cabinet Market Analysis
- 8.2 Africa Color Matching Cabinet Market Analysis by Country
- 8.3 Africa Color Matching Cabinet Market Analysis by Type
- 8.4 Africa Color Matching Cabinet Market Analysis by Application
- 8.5 Africa Color Matching Cabinet Market Analysis by Key Players
Chapter 9. Type Analysis
- 9.1 Rocker Switch Color Matching Cabinet
- 9.1.1 Global Rocker Switch Color Matching Cabinet Market
- 9.1.2 Global Rocker Switch Color Matching Cabinet Market by Region
- 9.2 Feather Touch Switch Color Matching Cabinet
- 9.2.1 Global Feather Touch Switch Color Matching Cabinet Market
- 9.2.2 Global Feather Touch Switch Color Matching Cabinet Market by Region
- 9.1 Rocker Switch Color Matching Cabinet
Chapter 10. Application Analysis
- 10.1 Packaging
- 10.1.1 Global Packaging Market
- 10.1.2 Global Packaging Market by Region
- 10.2 Consumer Goods
- 10.2.1 Global Consumer Goods Market
- 10.2.2 Global Consumer Goods Market by Region
- 10.3 Building
- 10.3.1 Global Building Market
- 10.3.2 Global Building Market by Region
- 10.4 Construction
- 10.4.1 Global Construction Market
- 10.4.2 Global Construction Market by Region
- 10.1 Packaging
Chapter 11. Qualitative Analysis (Subject to Data Availability)
- 11.1 Market Drivers
- 11.2 Market Restraints
- 11.3 Market Trends
- 11.4 Market Opportunity
- 11.5 Technological Road Map (Subject to Data Availability)
- 11.6 Product Life Cycle (Subject to Data Availability)
- 11.7 Customer and Buyer Behavior Analysis
- 11.7.1 Digital Engagement, Customer Experience & Relationship Analysis
- 11.7.2 Customer Buying Behavior & Purchase Decision Analysis
- 11.7.3 Vendor Selection, Supplier Preferences & Future Demand Trends
- 11.7.4 Pricing, Affordability & Value Perception Analysis
- 11.7.5 Customer Segmentation & Demand Pattern Analysis
- 11.8 PESTEL Analysis
- 11.8.1 Political Factors
- 11.8.2 Economic Factors
- 11.8.3 Social Factors
- 11.8.4 Technological Factors
- 11.8.5 Legal Factors
- 11.8.6 Environmental Factors
- 11.9 Industrial Chain Analysis (Subject to Data Availability)
- 11.9.1 Industry Chain Analysis
- 11.9.2 Manufacturing Cost Analysis
- 11.9.3 Supply Side Analysis
- 11.9.3.1 Raw Material Analysis
- 11.9.3.2 Raw Material Procurement Analysis
- 11.9.3.3 Raw Material Price Trend Analysis
- 11.10 Porter’s Five Forces Analysis
- 11.10.1 Bargaining Power of Suppliers
- 11.10.2 Bargaining Power of Buyers
- 11.10.3 Threat of New Entrants
- 11.10.4 Threat of Substitutes
- 11.10.5 Degree of Competition
- 11.11 Patent Analysis (Subject to Data Availability)
- 11.12 ESG Analysis
- 11.13 Geopolitical Outlook
- 11.13.1 Global Power Realignment & Strategic Alliances
- 11.13.2 Geopolitical Risk Landscape & Conflict Hotspots
- 11.13.3 International Trade Relations & Market Access Environment
- 11.13.4 Regulatory & Policy Shifts Impacting Cross-Border Operations
- 11.13.5 Supply Chain Resilience, Localization & Resource Nationalism
- 11.13.6 Technology Sovereignty & Digital Geopolitics
- 11.13.7 Strategic Implications for Investment, Growth & Market Entry
- 11.14 AI & Market Transformation
- 11.14.1 Competitive Landscape Disruption & Strategic Shifts
- 11.14.2 AI-Driven Transformation of Industry Value Chain
- 11.14.3 Evolution of Business Models & Revenue Streams
- 11.14.4 AI-Driven Product, Service & Innovation Transformation
- 11.14.5 Customer Behavior, AI Adoption & Future Market Evolution
Chapter 12. TOP 10 Country Analysis
- 12.1 Country 1
- 12.2 Country 2
- 12.3 Country 3
- 12.4 Country 4
- 12.5 Country 5
- 12.6 Country 6
- 12.7 Country 7
- 12.8 Country 8
- 12.9 Country 9
- 12.10 Country 10
Chapter 13. Research Findings
- 13.1 Key Takeaways
- 13.2 Analyst Point of View
- 13.3 Assumptions and Acronyms
Chapter 14. Research Methodology and Sources
- 14.1 Primary Data Collection
- 14.1.1 Steps for Primary Data Collection
- 14.1.1.1 Identification of KOL
- 14.1.2 Backward Integration
- 14.1.3 Forward Integration
- 14.1.4 How Primary Research Help Us
- 14.1.5 Modes of Primary Research
- 14.1.1 Steps for Primary Data Collection
- 14.2 Secondary Research
- 14.2.1 How Secondary Research Help Us
- 14.2.2 Sources of Secondary Research
- 14.3 Data Validation
- 14.3.1 Data Triangulation
- 14.4 Data Representation
- 14.1 Primary Data Collection
Athenaeum AI Dashboard
Our Proprietary Methodology
Cognitive Market Research and Consulting "The Full Truth" methodology — a rigorous triangulation process that combines primary research, secondary validation, and expert calibration. Implemented by Pratik Shirsath and team for the Color Matching Cabinet Market Analysis Market analysis.
Primary Intelligence Gathering
Direct interviews with 50+ industry stakeholders including manufacturers, distributors, end-users, and regulatory bodies across all six regions.
Secondary Data Triangulation
Cross-referencing against trade databases, customs records, financial filings, patent databases, and verified industry publications.
Expert Validation Protocol
Each data point undergoes validation by minimum two independent domain experts with 15+ years of industry experience.
Athenaeum AI Processing
Our proprietary AI platform aggregates, normalizes, and identifies patterns across 10,000+ data points to surface non-obvious insights.
Editorial & QA Review
Final review by senior analysts ensures accuracy, coherence, and actionability of all insights and recommendations.
Data Assurance Metrics
Analytical Coverage
To maintain the integrity of our proprietary methodology and protect our elite expert network, specific source disclosures are reserved for full-access partners. Our research framework is anchored by a 70:30 primary-to-secondary ratio, ensuring your strategy is driven by real-time market intelligence rather than recycled, publicly available, or AI-generated data. Every deliverable includes an exhaustive source directory and grants direct analyst access.
Sources from the Machinery and Equipment Industry
The Three Pillars of End-to-End Market Research Services
We don't just hand over data. We partner with your team across three integrated service lines — each designed to give you decision-grade intelligence on the Color Matching Cabinet Market Analysis market.
Market Survey
Structured primary research across both B2B and B2C channels. We design and execute custom surveys targeting manufacturers, distributors, procurement heads, and end-consumers in the color matching cabinet market analysis ecosystem — validated by our global panel of 10,000+ industrial respondents.
- Buyer intent & sentiment analysis
- Purchase cycle mapping
- Price sensitivity research
- Channel preference profiling
- Competitive perception study
Customized Market Data & Reports
Choose from our ready-to-access 8th Edition report or commission a fully customized dataset tailored to your exact strategic questions. Cross-splits, custom geographies, proprietary segmentation — we build the intelligence asset your board actually needs.
- Ready syndicate report
- Custom data scope & segmentation
- Excel quantitative models
- Board-ready PPT with key findings
- Secure cloud portal access
Strategic Consultation
Every survey and every report comes with dedicated analyst consultation. Our senior research team walks your leadership through findings, answers strategic questions in real-time, and helps translate data into your next board presentation or investment thesis.
- Dedicated analyst assigned to you
- Live walkthrough of findings
- Strategic Q&A sessions
- Go-to-market recommendations
- NDA-protected engagement
Customize This Report
Tell us the specific segments, regions, or companies you need — and we will tailor the deliverable to your requirements.