

Global Aqua Feed
Market Report
2025
Aqua Feed Market Report 2025 (Global Edition)
The global Aqua Feed Market size will be USD 68154.5 million in 2024. Rising seafood consumption is expected to boost sales to USD 109441.23 million by 2031, with a Compound Annual Growth Rate (CAGR) of 7.00% from 2024 to 2031.
The base year for the calculation is 2024. The historical will be 2021 to 2024. The year 2025 will be estimated one while the forecasted data will be from year 2025 to 2033. When we deliver the report that time we updated report data till the purchase date.
PDF Access: Password protected PDF file, Excel File Access: Quantitative data, PPT Report Access: For the presentation purpose, Cloud Access: Secure Company Account Access.
 |
| Share your contact details to receive free updated sample copy/pages of the recently published edition of Aqua Feed Market Report 2025.
Global Aqua Feed Market Report 2025 Market Size Split by Ingredients Outlook: (Soybean, Corn, Fishmeal, Fish Oil, Additives, Others), by Additives Outlook: (Antibiotics, Vitamins & minerals, Antioxida...
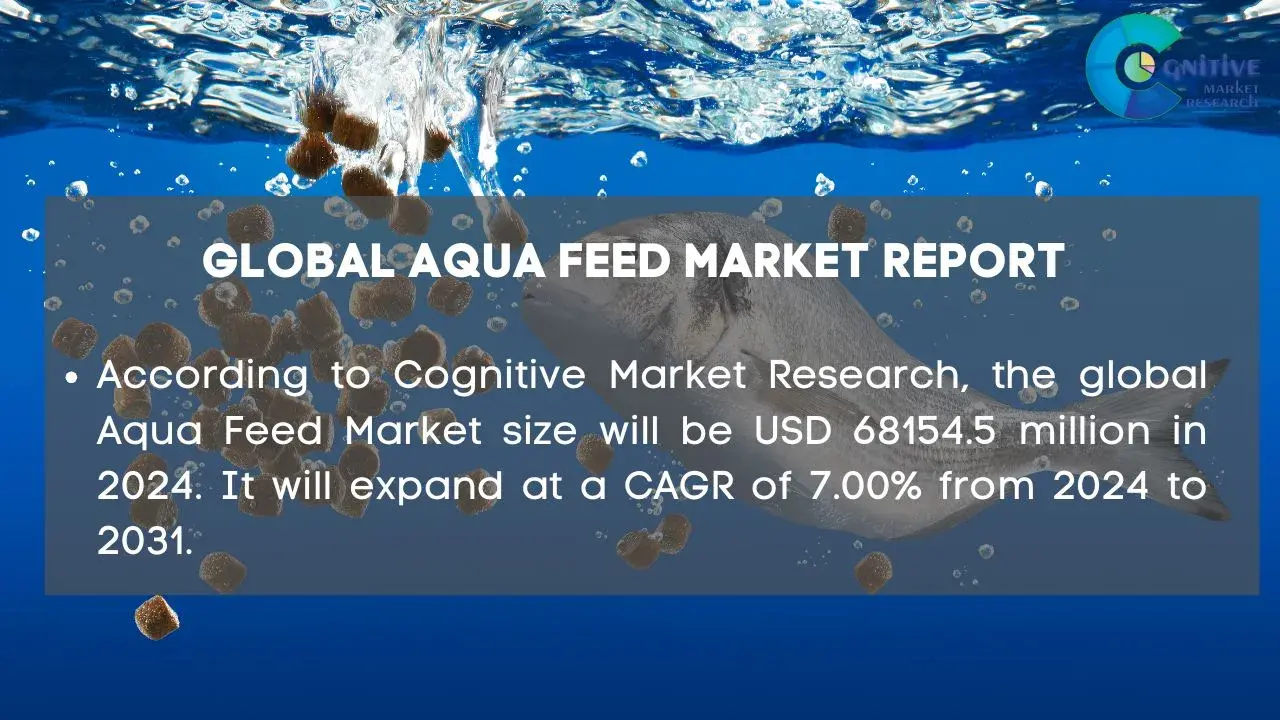
According to Cognitive Market Research, the global Aqua Feed Market size will be USD 68154.5 million in 2024. It will expand at a compound annual growth rate (CAGR) of 7.00% from 2024 to 2031.
- North America held the major market share for more than 40% of the global revenue with a market size of USD 27261.80 million in 2024 and will grow at a compound annual growth rate (CAGR) of 5.2% from 2024 to 2031.
- Europe accounted for a market share of over 30% of the global revenue with a market size of USD 20446.35 million.
- Asia Pacific held a market share of around 23% of the global revenue with a market size of USD 15675.54 million in 2024 and will grow at a compound annual growth rate (CAGR) of 9.0% from 2024 to 2031.
- Latin America had a market share of more than 5% of the global revenue with a market size of USD 3407.73 million in 2024 and will grow at a compound annual growth rate (CAGR) of 6.4% from 2024 to 2031.
- Middle East and Africa had a market share of around 2% of the global revenue and was estimated at a market size of USD 1363.09 million in 2024 and will grow at a compound annual growth rate (CAGR) of 6.7% from 2024 to 2031.
- The grower feed category is the fastest growing segment of the Aqua Feed industry
| 2021 | 2025 | 2033 | CAGR | |
|---|---|---|---|---|
| Global Aqua Feed Market Sales Revenue | $ 59.8 Billion | $ 73.8 Billion | $ 112.4 Billion | 5.404% |
| North America Aqua Feed Market Sales Revenue | $ 17.5902 Billion | $ 21.1216 Billion | $ 31.1678 Billion | 4.984% |
| United States Aqua Feed Market Sales Revenue | $ 14.2234 Billion | $ 16.9944 Billion | $ 24.9218 Billion | 4.902% |
| Canada Aqua Feed Market Sales Revenue | $ 2.1882 Billion | $ 2.6698 Billion | $ 4.0643 Billion | 5.394% |
| Mexico Aqua Feed Market Sales Revenue | $ 1.1785 Billion | $ 1.4574 Billion | $ 2.1817 Billion | 5.173% |
| Europe Aqua Feed Market Sales Revenue | $ 12.795 Billion | $ 15.3504 Billion | $ 23.0498 Billion | 5.213% |
| United Kingdom Aqua Feed Market Sales Revenue | $ 1.4458 Billion | $ 1.7653 Billion | $ 2.6968 Billion | 5.44% |
| Germany Aqua Feed Market Sales Revenue | $ 2.5206 Billion | $ 3.1008 Billion | $ 4.7944 Billion | 5.598% |
| France Aqua Feed Market Sales Revenue | $ 1.3563 Billion | $ 1.5811 Billion | $ 2.2589 Billion | 4.56% |
| Italy Aqua Feed Market Sales Revenue | $ 0.6525 Billion | $ 0.7215 Billion | $ 0.9911 Billion | 4.049% |
| Russia Aqua Feed Market Sales Revenue | $ 1.6378 Billion | $ 1.9034 Billion | $ 2.766 Billion | 4.782% |
| Spain Aqua Feed Market Sales Revenue | $ 0.8573 Billion | $ 0.9824 Billion | $ 1.4521 Billion | 5.006% |
| Sweden Aqua Feed Market Sales Revenue | $ 0.627 Billion | $ 0.7215 Billion | $ 1.0142 Billion | 4.349% |
| Denmark Aqua Feed Market Sales Revenue | $ 0.5502 Billion | $ 0.6447 Billion | $ 0.945 Billion | 4.896% |
| Switzerland Aqua Feed Market Sales Revenue | $ 0.5118 Billion | $ 0.5833 Billion | $ 0.8298 Billion | 4.504% |
| Luxembourg Aqua Feed Market Sales Revenue | $ 0.3583 Billion | $ 0.3991 Billion | $ 0.5762 Billion | 4.698% |
| Rest of Europe Aqua Feed Market Sales Revenue | $ 2.2775 Billion | $ 2.9473 Billion | $ 4.7252 Billion | 6.078% |
| Asia Pacific Aqua Feed Market Sales Revenue | $ 21.644 Billion | $ 26.8632 Billion | $ 42.9513 Billion | 6.042% |
| China Aqua Feed Market Sales Revenue | $ 8.5926 Billion | $ 10.7453 Billion | $ 17.6959 Billion | 6.434% |
| Japan Aqua Feed Market Sales Revenue | $ 2.3938 Billion | $ 2.8636 Billion | $ 4.4068 Billion | 5.536% |
| India Aqua Feed Market Sales Revenue | $ 3.8743 Billion | $ 4.9697 Billion | $ 8.2467 Billion | 6.535% |
| South Korea Aqua Feed Market Sales Revenue | $ 1.2337 Billion | $ 1.3969 Billion | $ 2.0187 Billion | 4.71% |
| Australia Aqua Feed Market Sales Revenue | $ 0.5476 Billion | $ 0.6259 Billion | $ 0.9149 Billion | 4.859% |
| Singapore Aqua Feed Market Sales Revenue | $ 0.606 Billion | $ 0.6984 Billion | $ 1.0308 Billion | 4.986% |
| South East Asia Aqua Feed Market Sales Revenue | $ 3.2401 Billion | $ 4.0751 Billion | $ 6.1592 Billion | 5.299% |
| Taiwan Aqua Feed Market Sales Revenue | $ 0.6493 Billion | $ 0.7522 Billion | $ 1.1167 Billion | 5.064% |
| Rest of APAC Aqua Feed Market Sales Revenue | $ 0.5065 Billion | $ 0.7361 Billion | $ 1.3616 Billion | 7.992% |
| South America Aqua Feed Market Sales Revenue | $ 3.408 Billion | $ 5.0922 Billion | $ 7.8707 Billion | 5.594% |
| Brazil Aqua Feed Market Sales Revenue | $ 1.169 Billion | $ 1.7619 Billion | $ 2.7469 Billion | 5.708% |
| Argentina Aqua Feed Market Sales Revenue | $ 0.4158 Billion | $ 0.606 Billion | $ 0.8894 Billion | 4.913% |
| Colombia Aqua Feed Market Sales Revenue | $ 0.2624 Billion | $ 0.3972 Billion | $ 0.6218 Billion | 5.762% |
| Peru Aqua Feed Market Sales Revenue | $ 0.1806 Billion | $ 0.2597 Billion | $ 0.3857 Billion | 5.067% |
| Chile Aqua Feed Market Sales Revenue | $ 0.1636 Billion | $ 0.2342 Billion | $ 0.3542 Billion | 5.304% |
| Rest of South America Aqua Feed Market Sales Revenue | $ 1.2167 Billion | $ 1.8332 Billion | $ 2.8728 Billion | 5.776% |
| Middle East Aqua Feed Market Sales Revenue | $ 2.6666 Billion | $ 3.2915 Billion | $ 4.4525 Billion | 3.849% |
| Saudi Arabia Aqua Feed Market Sales Revenue | $ 1.0213 Billion | $ 1.2771 Billion | $ 1.7222 Billion | 3.809% |
| Turkey Aqua Feed Market Sales Revenue | $ 0.6347 Billion | $ 0.7702 Billion | $ 1.0285 Billion | 3.682% |
| UAE Aqua Feed Market Sales Revenue | $ 0.3056 Billion | $ 0.3805 Billion | $ 0.5299 Billion | 4.226% |
| Egypt Aqua Feed Market Sales Revenue | $ 0.2933 Billion | $ 0.3686 Billion | $ 0.5076 Billion | 4.079% |
| Qatar Aqua Feed Market Sales Revenue | $ 0.2491 Billion | $ 0.3173 Billion | $ 0.4337 Billion | 3.983% |
| Rest of Middle East Aqua Feed Market Sales Revenue | $ 0.1627 Billion | $ 0.1777 Billion | $ 0.2306 Billion | 3.31% |
| Africa Aqua Feed Market Sales Revenue | $ 1.6861 Billion | $ 2.0812 Billion | $ 2.9459 Billion | 4.439% |
| Nigeria Aqua Feed Market Sales Revenue | $ 0.4215 Billion | $ 0.5245 Billion | $ 0.7541 Billion | 4.645% |
| South Africa Aqua Feed Market Sales Revenue | $ 0.7351 Billion | $ 0.8991 Billion | $ 1.2579 Billion | 4.287% |
| Rest of Africa Aqua Feed Market Sales Revenue | $ 0.5294 Billion | $ 0.6576 Billion | $ 0.9338 Billion | 4.48% |
| Base Year | 2024 |
| Historical Data Time Period | 2021-2024 |
| Forecast Period | 2025-2033 |
| Market Split by Ingredients Outlook: |
|
| Market Split by Additives Outlook: |
|
| Market Split by Species Outlook: |
|
| Market Split by Form Outlook: |
|
| Market Split by Lifecycle Outlook: |
|
| List of Competitors |
|
| Regional Analysis |
|
| Country Analysis |
|
Market Drivers:
| |
Market Restrains:
| |
Market Trends:
| |
Report scope is customizable as we have a huge database of Aqua Feed industry. We can deliver an exclusive report Edition/Consultation as per your data requirements. Request for your Free Sample Pages.
Aqua Feed Market is Segmented as below. Particular segment of your interest can be provided without any additional cost. Download the Sample Pages!
Aqua Feed Market Report Description
Introduction of the Aqua Feed Market
Any feed used to nourish aquatic animals farmed for food as part of aquaculture is referred to as aquafeed. Both farmed and wild fish require a well-balanced combination of essential nutrients, including vitamins, fatty acids, and amino acids, for optimum growth. Certain lipids, vitamins, minerals, and amino acids—the building blocks of protein—are all present in aquafeed. These come from a range of ingredients in the feed, including as plants, animal trimmings, fishmeal, and fish oil. Vitamins, antioxidants, amino acids, enzymes, acidifiers, and binders in dry, wet, and moist forms are the primary components of aquafeed. These goods are sold online, through wholesalers, supermarkets, hypermarkets, direct sales, and indirect sales, among other channels. Aquaculture production is expected to increase due to rising seafood consumption and consumer expenditure on fish and fish products including fish oil, fish meal, and fish silage.
In February 2024, Skretting, a well-known aquafeed manufacturer with headquarters in Norway, recently opened a brand-new production plant in Surat, India. Three production lines and cutting-edge technology are reportedly included in the new facility, which should have an annual output capacity of about 50,000 metric tons. (Source: https://www.skretting.com/en/news-and-stories/skretting-india-launches-state-of-the-art-shrimp-and-fish-feed-facility-in-surat/)
Aqua Feed Market Size
Market Dynamics of Aqua Feed Market
Key Drivers for Aqua Feed Market
-
Growing Consumption of Seafood to Boost Market Growth
The market for aqua feed is significantly influenced by the rising consumption of seafood worldwide. Demand for seafood is rising, especially in emerging nations, as populations grow and dietary preferences change toward sustainable, high-protein sources. The demand for effective aquaculture methods, such as the creation of premium aqua feed to promote the growth and well-being of fish and other aquatic species, is fueled by the rise in seafood consumption. The need for aqua feed is further fueled by the increased nutritional benefits of seafood and the emergence of aquaculture as a sustainable substitute for wild-caught fish. The expansion of the aquaculture sector immediately increases the requirement for specialized, nutrient-dense aqua feed formulations as the sector emerges as a major seafood solution. The increase in demand for seafood or fishery products is expected to boost demand for high-quality aquafeed to maintain the quality of the products for the customers. Therefore, increasing seafood consumption is driving the growth of the aquafeed market.
-
Increasing R&D Expenditures to Drive Market Growth
The market for aqua feed is expanding due in large part to rising research and development (R&D) costs. Businesses are making significant investments in research and development to create novel formulations that enhance fish growth, health, and feed conversion rates as the demand for sustainable, effective, and premium feed increases. Investigating substitute protein sources, such as plant-based components or insect meal, can lessen reliance on conventional fishmeal and address environmental issues. Improved production and reduced waste are also made possible by more specialized diets for various animals thanks to developments in nutritional science. R&D also helps businesses satisfy changing consumer demands for ethically and environmentally sourced products as well as changing regulatory requirements, which increases market competitiveness and growth.
- Advances in Aquaculture Technology to Drive Market Growth
Advances in aquaculture technology have improved the efficiency and sustainability of aqua feed production. For example, the use of recirculating aquaculture systems (RAS) and integrated multi-trophic aquaculture (IMTA) systems has reduced the environmental impact of aquaculture and improved the quality of aqua feed.
For instance, in Europe, Minister for Agriculture, Food and the Marine, Charlie McConalogue, today announced approval for a scheme that will provide €20 million in funding for capital investments to accelerate the sustainable growth of the Aquaculture Sector. While investment will generally be supported at a maximum of 40% of eligible costs, a higher incentive rate of 50% will apply to certain climate change investments, investment in seaweed aquaculture, and investment in Recirculating Aquaculture System (RAS) and Integrated Multi-Trophic Aquaculture (IMTA) aquaculture projects. These advances have also enabled the production of more specialized and nutritious aqua feeds. For example, the use of precision feeding systems allows farmers to tailor their feeding programs to the specific needs of their fish, improving growth rates and reducing waste. Additionally, the development of new ingredients and formulations has enabled the production of aqua feeds that are more sustainable and environmentally friendly.
(https://www.gov.ie/en/press-release/c2373-minister-mcconalogue-announces-20m-brexit-sustainable-aquaculture-growth-scheme/)
Restraint Factor for the Aqua Feed Market
-
Price volatility for raw materials may limit market expansion
The market's expansion may be hampered by high price volatility related to the raw ingredients utilized in feed preparation. For example, a large increase in the cost of maize, soybeans, or other raw materials can have a direct effect on the final price of the product, which could hurt sales. Furthermore, it is predicted that fewer individuals will choose vegetarian diets and avoid non-vegetarian foods, which could have a detrimental impact on the market for fish. For instance, it was demonstrated during an UndercurrentNews webinar that, as with any other natural feed ingredient, fishmeal and fish oil are highly dependent on climate conditions. Changes in the weather regime can affect, positively or negatively, the supply of all natural ingredients and, in turn, alter their equilibrium price. This is what causes price volatility, a common feature of all feed ingredients.
The volatility of raw material prices can make it challenging for aqua feed manufacturers to maintain profit margins and predict their costs. This can lead to reduced investment in research and development, decreased production capacity, and higher prices for aqua feed, which can ultimately impact the sustainability of the aquaculture industry.
We have various report editions of Aqua Feed Market, hence please contact our sales team and author directly to obtain/purchase a desired Edition eg, Global Edition, Regional Edition, Country Specific Report Edition, Company Profiles, Forecast Edition, etc. Request for your Free Sample PDF/Online Access.
Impact of Tariff Trumph on Agriculture Industry
In 2025, global agricultural trade is under major strain following President Trump’s Liberation Day Tariffs, which introduced steep duties to correct trade imbalances. Tariffs now range from 10% on imports from allies like Japan to as high as 46% on Vietnamese goods and 34% on Chinese agricultural products, with a blanket 25% on agri-machinery, fertilizers, and processed foods. This has significantly raised input costs for U.S. farmers and triggered retaliatory tariffs from key partners like China, the EU, and Brazil. China’s countermeasures up to 120% on U.S. exports like soybeans, pork, and dairy—have already slashed Q1 soybean exports by 19.7%. Canada and others have also tightened import rules, compounding uncertainty.
Key agriculture sectors are struggling. Row crop farmers face slumping export prices and higher input costs, leading many to explore alternative crops and new markets in South Asia and Africa. Dairy and pork producers are dealing with oversupply and weak demand, especially from China and the EU. Fruit and vegetable growers are hit by increased spoilage and packaging costs, while food processors are seeing a 10–14% rise in unit costs due to equipment and material tariffs. Logistics firms, meanwhile, are grappling with slower exports and rising warehousing needs, pushing them to revamp inland routes and distribution strategies.
China, while not the largest exporter of agricultural goods to the U.S., is a key supplier of specific inputs like agrochemicals, additives, seafood, and processed foods. Many of these goods are also routed through intermediaries in Asia, so tariffs aimed at China disrupt broader global supply chains. U.S. agribusinesses are seeing input costs rise by up to 22%, complicating seasonal planning and tightening margins. While some are turning to alternate sourcing from India, Latin America, or Southeast Asia, challenges like logistics and compliance slow the transition.
To adapt, agribusinesses are increasingly relying on market research. It helps identify lower-risk suppliers, monitor input costs, optimize fragmented supply chains, and understand shifting consumer behaviors. Firms are also tracking regulatory changes and running scenario planning models to anticipate disruptions. Major companies are responding by reshoring supply chains, investing in local operations, and realigning exports toward tariff-exempt markets. The most resilient players are those using real-time data and strategic foresight to reconfigure operations and maintain competitiveness amid ongoing trade volatility.
Aqua Feed Market Insights Video
Competitive Landscape of the Aqua Feed Market
In the Aqua Feed Market's competitive landscape, numerous key competitors are driving innovation and growth. The makers of aquafeed are always conducting research and development to create a variety of natural and organic aquafeed that can be utilized for the production of different species. Market rivalry is encouraging technological and design innovations to create Aqua Feed that fulfill both consumer wants and sustainability goals, keeping the market dynamic and competitive.
- In December 2023, A brand-new aquafeed was introduced by the Indian government during its Global Bio-India 2023 event. Known as Bio Guru 3F Pro: Bio-fermented Fish Feed, the new aquafeed is the first vegan aquafeed in India. According to reports, this event marks India's foray into cruelty-free aquaculture. (Source: https://thebiostartups.com/news/9/733/indias-first-vegan-fish-feed-launched-in-global-bio-india-2023-ready-to-sale-and-support-healthy-aquaculture-worldwide.html) In June 2021, A new Aquafeed standard was introduced by the Aquaculture Stewardship Council (ASC) to address any careless and unsustainable practices in the sector. (Source: https://asc-aqua.org/producers/asc-standards/feed-standard/) In August 2021, The Central Institute of Fisheries technique (CIFT) developed a novel technique that offers viable revenue options while addressing the risk of fisheries waste being converted into fish feed. (Source: https://www.cift.res.in/uploads/FishtechReport/Fish%20Tec%20Report_2023%20July%20Dec%20Final_20240516102119.pdf)
• 3 June 2024, Aquafeed company Skretting has announced the launch of a new feed formulation concept through which it aims to increase the precision and efficacy of its feeds whilst reducing unnecessary excess.
• 21 November 2024, Aker QRILL Company, a new company spun out of Aker BioMarine, has been launched. The company, which will focus on providing marine ingredients for the aquaculture, animal feed, and nutraceutical industries, is owned by American Industrial Partners (AIP) and Aker Capital.
• 12 December 2024, Aquafeed producer BioMar has launched a new functional feed developed to help farmed fish endure challenging conditions, such as outbreaks of salmonid rickettsial septicaemia (SRS).
Top Companies Market Share in Aqua Feed Industry: (In no particular order of Rank)
- Cargill Incorporated (Minnesota U.S.)
- Archer Daniels Midland Company (Illinois U.S.)
- Alltech Inc. (U.S.)
- Purina Animal Nutrition (Missouri U.S.)
- Ridley Corp Ltd (Australia)
- Nutreco N.V. (Amersfoort Netherlands)
- Aller Aqua A/S (Christiansfeld Denmark)
- BioMar A/S (Denmark)
- Dibaq Aquaculture (Spain)
- Beneo GmbH (Germany)
- Confidential Data
- Access The Paid Version
- Data Hidden
If any Company(ies) of your interest has/have not been disclosed in the above list then please let us know the same so that we will check the data availability in our database and provide you the confirmation or include it in the final deliverables.
Regional Analysis of the Aqua Feed Market
Which Region Dominates the Aqua Feed Market in 2024?
According to Cognitive Market Research, North America currently dominates the Aqua Feed market, and the region is expected to have significant growth during the projected period. The large profit margin on aquaculture exports is another factor contributing to the region's latent growth in the high-quality fish feed sector.
Which Region is Expanding at the Fastest CAGR?
Asia-Pacific is expected to make significant gains during the projected period, with the greatest compound annual growth rate (CAGR), dur to rising seafood consumption. Population growth and increased health consciousness are the main causes of this, as they are driving the market's expansion.
The current report Scope analyzes Aqua Feed Market on 5 major region Split (In case you wish to acquire a specific region edition (more granular data) or any country Edition data then please write us on info@cognitivemarketresearch.com
- North America (United States, Canada, Mexico)
- Europe (United Kingdom, France, Germany, Italy, Russia, Spain, Sweden, Denmark, Switzerland, Luxembourg, Rest of Europe)
- Asia Pacific (China, Japan, South Korea, India, Australia, Singapore, Taiwan, South East Asia, Rest of APAC)
- Latin America (Brazil, Argentina, Colombia, Peru, Chile, Rest of South America)
- Middle East (Saudi Arabia, Turkey, UAE, Egypt, Qatar, Rest of Middle East)
- Africa (Nigeria, South Africa, Rest of Africa)
Aqua Feed Market Share (%) by Region (2021-2033)
Aqua Feed Market Share (%) by Country
The above graph is for illustrative purposes only.
To learn more about geographical trends request the free sample pages.
Get Free Sample
North America Aqua Feed Market Analysis
According to Cognitive Market Research, the global Aqua Feed Market size was estimated at USD 68154.5 Million, out of which North America held the major market share of more than 40% of the global revenue with a market size of USD 27261.80 million in 2024 and will grow at a compound annual growth rate (CAGR) of 5.2% from 2024 to 2031.
- According to Cognitive Market Research, the US had a major share in the Aqua Feed Market with a market size of USD 21509.56 million in 2024 and is projected to grow at a CAGR of 5.0% during the forecast period. The U.S. market's Stringent governmental regulations against pollution.
- The Canada Aqua Feed Market had a market share of USD 3271.42 million in 2024 and is projected to grow at a CAGR of 6.0% during the forecast period. Canada’s rising awareness among the population.
- The Mexico Aqua Feed Market is projected to witness growth at a CAGR of 5.7% during the forecast period, with a market size of USD 2480.82 million in 2024.
Europe Aqua Feed Market Analysis
According to Cognitive Market Research, the global Aqua Feed Market size was estimated at USD 68154.5 Million, out of which Europe held the market share of more than 30% of the global revenue with a market size of USD 20446.35 million in 2024 and will grow at a compound annual growth rate (CAGR) of 5.5% from 2024 to 2031.
- The United Kingdom Aqua Feed Market had a market share of USD 3434.99 million in 2024 and is projected to grow at a CAGR of 6.3% during the forecast period. In the UK, Aqua Feed sales witness an upswing due to the increasing focus on sustainable aquaculture methods.
- The France Aqua Feed Market is projected to witness growth at a CAGR of 4.7% during the forecast period, with a market size of USD 1881.06 million in 2024.
- According to Cognitive Market Research, the German Aqua Feed Market size was valued at USD 4048.38 million in 2024 and is projected to grow at a CAGR of 5.7% during the forecast period. In Germany, Aqua Feed surged due to the Increased focus of the manufacturers and major market players.
- The Italy Aqua Feed Market is projected to witness growth at a CAGR of 4.9% during the forecast period, with a market size of USD 1758.39 million in 2024.
- The Russia Aqua Feed Market is projected to witness growth at a CAGR of 4.5% during the forecast period, with a market size of USD 3169.18 million in 2024.
- The Spain Aqua Feed Market is projected to witness growth at a CAGR of 4.6% during the forecast period with a market size of USD 1676.60 million in 2024
- The Luxembourg Aqua Feed Market is projected to witness growth at a CAGR of 5.6% during the forecast period, with a market size of USD 633.84 million in 2024.
- The Portugal Aqua Feed Market is projected to witness growth at a CAGR of 5.3% during the forecast period, with a market size of USD 429.37 million in 2024.
- The Greece Aqua Feed Market is projected to witness growth at a CAGR of 5.8% during the forecast period, with a market size of USD 245.36 million in 2024.
- The Rest of Europe's Aqua Feed Market is projected to witness growth at a CAGR of 4.2% during the forecast period, with a market size of USD 3169.18 million in 2024.
Asia Pacific Aqua Feed Market Analysis
According to Cognitive Market Research, the global Aqua Feed Market size was estimated at USD 68154.5 Million, out of which Asia Pacific held the market share of around 23% of the global revenue with a market size of USD 15675.54 million in 2024 and will grow at a compound annual growth rate (CAGR) of 9.0% from 2024 to 2031.
- According to Cognitive Market Research, the China Aqua Feed Market size was valued at USD 7053.99 million in 2024 and is projected to grow at a CAGR of 8.5% during the forecast period. Aqua Feed surged in China due to Increased focus of the manufacturers and major market players.
- The Japan Aqua Feed Market is projected to witness growth at a CAGR of 7.5% during the forecast period, with a market size of USD 2163.22 million in 2024.
- The India Aqua Feed Market had a market share of USD 1881.06 million in 2024 and is projected to grow at a CAGR of 10.8% during the forecast period. India's rising awareness among the populations .
- The South Korean Aqua Feed Market is projected to witness growth at a CAGR of 8.1% during the forecast period, with a market size of USD 1567.55 million in 2024.
- The Australian Aqua Feed Market is projected to witness growth at a CAGR of 8.7% during the forecast period, with a market size of USD 815.13 million in 2024.
- The South East Asia Aqua Feed Market is projected to witness growth at a CAGR of 10.0% during the forecast period, with a market size of USD 1081.61 million in 2024.
- The Rest of Asia Pacific Aqua Feed Market is projected to witness growth at a CAGR of 8.8% during the forecast period, with a market size of USD 1112.96 million in 2024.
South America Aqua Feed Market Analysis
According to Cognitive Market Research, the global Aqua Feed Market size was estimated at USD 68154.5 Million, out of which the Latin America held the market share of around 5% of the global revenue with a market size of USD 3407.73 million in 2024 and will grow at a compound annual growth rate (CAGR) of 6.4% from 2024 to 2031.
- According to Cognitive Market Research, the Brazil Aqua Feed Market size was valued at USD 1458.51 million in 2024 and is projected to grow at a CAGR of 7.0% during the forecast period. Aqua Feed flourished in Brazil due to increasing demand for fish and seafood.
- Argentina's Aqua Feed Market had a market share of USD 572.50 million in 2024 and is projected to grow at a CAGR of 7.3% during the forecast period. Argentina's rising aquaculture output.
- Colombia Aqua Feed Market is projected to witness growth at a CAGR of 6.2% during the forecast period, with a market size of USD 303.29 million in 2024.
- Peru Aqua Feed Market is projected to witness growth at a CAGR of 6.6% during the forecast period, with a market size of USD 279.43 million in 2024.
- Chile Aqua Feed Market is projected to witness growth at a CAGR of 6.7% during the forecast period, with a market size of USD 245.36 million in 2024.
- The Rest of Latin America's Aqua Feed Market is projected to witness growth at a CAGR of 5.5% during the forecast period, with a market size of USD 548.64 million in 2024.
Middle East Aqua Feed Market Analysis
According to Cognitive Market Research, the global Aqua Feed Market size was estimated at USD 68154.5 Million, out of which the Middle East and Africa held the major market share of around 2% of the global revenue with a market size of USD 1363.09 million in 2024 and will grow at a compound annual growth rate (CAGR) of 6.7% from 2024 to 2031..
- The GCC Countries Aqua Feed Market is projected to witness growth at a CAGR of 7.5% during the forecast period, with a market size of USD 583.40 million in 2024. Aqua Feed sales flourish due to the presence of major market players.
- The Egypt Aqua Feed Market is projected to witness growth at a CAGR of 7.0% during the forecast period, with a market size of USD 143.12 million in 2024.
- The South Africa Aqua Feed Market is projected to witness growth at a CAGR of 7.7% during the forecast period, with a market size of USD 215.37 million in 2024. Aqua Feed sales flourished in South Africa due to increasing demand and regulatory support.
- The Turkey Aqua Feed Market is projected to witness growth at a CAGR of 6.2% during the forecast period, with a market size of USD 117.23 million in 2024.
- The Nigeria Aqua Feed Market is projected to witness growth at a CAGR of 5.8% during the forecast period, with a market size of USD 143.12 million in 2024.
- The Rest of the MEA Aqua Feed Market is projected to witness growth at a CAGR of 5.7% during the forecast period, with a market size of USD 160.84 million in 2024.
Aqua Feed Market Analysis
Global Aqua Feed Market Report 2025 Edition talks about crucial market insights with the help of segments and sub-segments analysis. In this section, we reveal an in-depth analysis of the key factors influencing Aqua Feed Industry growth. Aqua Feed market has been segmented with the help of its Ingredients Outlook:, Additives Outlook: Species Outlook:, and others. Aqua Feed market analysis helps to understand key industry segments, and their global, regional, and country-level insights. Furthermore, this analysis also provides information pertaining to segments that are going to be most lucrative in the near future and their expected growth rate and future market opportunities. The report also provides detailed insights into factors responsible for the positive or negative growth of each industry segment.
How are Segments Performing in the Global Aqua Feed Market?
Aqua Feed Market Ingredient Segment Analysis
According to Cognitive Market Research, Soyabean are likely to dominate the Aqua Feed Market over the forecast period. Soyabean is now frequently used in feed preparation to improve the general growth and development of aquatic species. The industry's need for soybeans is expected to increase as a result of the growing use of soybean meal and cake in the production of organic feed.
The Additives is the fastest-growing segment in the Aqua Feed Market. Amino acids in particular are essential macromolecules required for the proper growth, development, and general upkeep of aquaculture. Manufacturer demand for additives is expected to increase as fish breeders become more inclined to use high-quality feed.
Aqua Feed Market Share (%) by Ingredients Outlook: in 2021-2033
The above Chart is for representative purposes and does not depict actual sale statistics. Access/Request the quantitative data to understand the trends and dominating segment of Aqua Feed Industry. Request a Free Sample PDF!
Aqua Feed Market Additives Segment Analysis
According to Cognitive Market Research, the amino acids segment holds the largest share of the market. Its benefits, which include boosting immunity, improving larval performance, optimizing fish metabolic transformation efficiency, increasing tolerance to environmental stressors, mediating spawning efficiency and timing.
In the Aqua Feed Market, the antibiotics has been expanding at a rapid pace. Antibiotics are another common component in aquafeed, in addition to amino acids. By enhancing general health, they encourage greater growth and are employed to increase efficiency and productivity.
Aqua Feed Market Share (%) by Additives Outlook: in 2021-2033
2021
2025
2033
The above Graph is for representation purposes only. This chart does not depict actual Market share.
To learn more about market share request the free sample pages.
Get Free Sample
Aqua Feed Species Outlook: Segment Analysis
Aqua Feed Market Species Segment Analysis
According to Cognitive Market Research, The Fish segment holds the largest market share. Sales of fish feed are anticipated to benefit from the massive expansion of fish farming to close the supply and demand gap. Supporting the base of the food chain and maintaining a healthy fish population can be achieved with high-quality fish feed.
In the Aqua Feed Market, the rapidly growing sector is the mollusks category. The growing demand for fish feed from mollusk farmers is expected to increase as a result of the increased production of clams and oysters due to their growing appeal as a significant source of nourishment for people.
- Fish
- Crustaceans
- Others
Aqua Feed Form Outlook: Segment Analysis
Aqua Feed Market Form Segment Analysis
According to Cognitive Market Research, the Dry Form segment dominates the market. The aquaculture business around the world has a strong need for pellet feed because of its potential to increase fish feed conversion ratio. Because of its exceptional palatability and effectiveness in improving fish performance, dry fish feed is becoming more and more popular.
Wet Form is projected to be the fastest-growing segment in the Aqua Feed Market. Wet feeds are another popular type of aquafeed product. It has between 45% and 70% moisture content. High moisture content components including fishery waste, undried fodder, and slaughterhouse waste are used to make them.
- Dry
- Moist
- Wet
Aqua Feed Lifecycle Outlook: Segment Analysis
Aqua Feed Market Lifecycle Segment Analysis
According to Cognitive Market Research, the grower feed segment dominates the market. Its increasing use in animals between the ages of 6 and 20 weeks to meet their nutritional needs is the reason for its high share. The animal is fed this kind of feed until it is ready to begin mating and laying eggs.
Finisher Feed is projected to be the fastest-growing segment in the Aqua Feed Market. In addition, growth meals are frequently followed by finisher feeds. Adult fish and animals older than 20 weeks are typically fed finisher diets. It gives the animals the nutrients they need to meet their basic needs. It contains 21% high-energy protein to support life.
- Starter feed
- Grower feed
- Finisher feed
- Brooder feed
Author's Detail
Pratik ShirsathResearch Associate at Cognitive Market Research
Pratik Shirsath is an accomplished Research Analyst with extensive expertise in the agriculture sector, bringing over one years of experience in market research and analysis. Pratik specializes in secondary research, competitive benchmarking, and data-driven insights that empower organizations to make strategic decisions and achieve their goals.
In his current role, Pratik leads research projects focused on the agriculture sector, driving initiatives that identify emerging market trends, assess competitive landscapes, and uncover growth opportunities. His proficiency in designing effective research methodologies and translating complex data into actionable strategies has consistently supported his organization’s objectives.
Pratik's dedication to delivering high-quality research and his in-depth knowledge of the agriculture industry have made him a trusted resource for his team and stakeholders. Passionate about innovation and sustainability in agriculture, he remains committed to advancing his expertise to navigate the evolving challenges and opportunities in the sector.
Pratik Shirsath is an accomplished Research Analyst with extensive expertise in the agriculture sector, bringing over one years of experience in market research and analysis. Pratik specializes in secondary research, competitive benchmarking, and data-driven insights that empower organizations to make strategic decisions and achieve their goals.
In his current role, Pratik leads research projects focused on the agriculture sector, driving initiatives that identify emerging market trends, assess competitive landscapes, and uncover growth opportunities. His proficiency in designing effective research methodologies and translating complex data into actionable strategies has consistently supported his organization’s objectives.
Pratik's dedication to delivering high-quality research and his in-depth knowledge of the agriculture industry have made him a trusted resource for his team and stakeholders. Passionate about innovation and sustainability in agriculture, he remains committed to advancing his expertise to navigate the evolving challenges and opportunities in the sector.
Author's Conclusion
Conclusion
- The global Aqua Feed Market will expand significantly by 7.00% CAGR between 2024 and 2031.
- Fish are expected to dominate the Aqua Feed Market over the forecast period. Sales of fish feed are anticipated to benefit from the massive expansion of fish farming to close the supply and demand gap.
- The dry form segment has the biggest market share. The aquaculture business around the world has a strong need for pellet feed because of its potential to increase fish feed conversion ratio.
Frequently Asked Questions (FAQs)
Please note, we have not disclose, all the sources consulted/referred during a market study due to confidentiality and paid service concern. However, rest assured that upon purchasing the service or paid report version, we will release the comprehensive list of sources along with the complete report and we also provide the data support where you can intract with the team of analysts who worked on the report.
Latest News about Aqua Feed Market
Sources from Agriculture Industry
- http://education.nationalgeographic.org
- http://www.mdpi.com
- http://agriculture.vermont.gov
- http://www.ams.usda.gov
- http://www.fsa.usda.gov
- http://www2.illinois.gov
- http://www.feedthefuture.gov
- https://www.nass.usda.gov
- http://www.nhb.gov.in
- http://horticultureresearch.net
- http://ashs.org
- http://www.fwi.co.uk
- http://www.agupdate.com
- http://www.statcan.gc.ca
- http://www.oecd-ilibrary.org
- http://iasri.icar.gov.in
- http://www.fao.org
- http://apeda.gov.in
- http://www.ncbi.nlm.nih.gov
- http://unctad.org
- http://www.agriculture.gov.au
Aqua Feed Market Report Table of Content
Disclaimer:
- This is just a redacted sample pages of the actual deliverable report and only for representative purposes
- Charts/Graphs/Numbers/data are only for Representative purposes and do not depict actual statistics.
- The table of Contents differs according to the user License selection. Current Displayed TOC is for the Corporate User License Report Edition. TOC Customization options: Add or Remove section/s Or chapter/s from the report.
- Specific Tables, Graphs, Sections, and Chapters can be ordered at a discounted price.
- If applicable; On Request Volume Data will also be provided (at an Additional Cost).
| Ingredients Outlook: | Soybean, Corn, Fishmeal, Fish Oil, Additives, Others |
| Additives Outlook: | Antibiotics, Vitamins & minerals, Antioxidants, Amino acids, Enzymes, Probiotics & prebiotics, Others |
| Species Outlook: | Fish, Crustaceans, Others |
| Form Outlook: | Dry, Moist, Wet |
| Lifecycle Outlook: | Starter feed, Grower feed, Finisher feed, Brooder feed |
| List of Competitors | Cargill Incorporated (Minnesota U.S.), Archer Daniels Midland Company (Illinois U.S.), Alltech Inc. (U.S.), Purina Animal Nutrition (Missouri U.S.), Ridley Corp Ltd (Australia), Nutreco N.V. (Amersfoort Netherlands), Aller Aqua A/S (Christiansfeld Denmark), BioMar A/S (Denmark), Dibaq Aquaculture (Spain), Beneo GmbH (Germany) |
This chapter will help you gain GLOBAL Market Analysis of Aqua Feed. Further deep in this chapter, you will be able to review Global Aqua Feed Market Split by various segments and Geographical Split.
Chapter 1 Global Market Analysis
-
1.1 Global Aqua Feed Revenue Market Size, Trend Analysis 2021 - 2033
-
1.2 Global Aqua Feed Market Size By Regions 2021 - 2033
Global Market has been segmented on the basis 5 major regions such as North America, Europe, Asia-Pacific, Middle East & Africa, and Latin America.
-
1.2.1 Global Aqua Feed Revenue Market Size By Region
-
-
1.3 Global Aqua Feed Market Size By Ingredients Outlook: 2021 - 2033
-
1.3.1 Soybean Market Size
-
1.3.2 Corn Market Size
-
1.3.3 Fishmeal Market Size
-
1.3.4 Fish Oil Market Size
-
1.3.5 Additives Market Size
-
1.3.6 Others Market Size
-
-
1.4 Global Aqua Feed Market Size By Additives Outlook: 2021 - 2033
-
1.4.1 Antibiotics Market Size
-
1.4.2 Vitamins & minerals Market Size
-
1.4.3 Antioxidants Market Size
-
1.4.4 Amino acids Market Size
-
1.4.5 Enzymes Market Size
-
1.4.6 Probiotics & prebiotics Market Size
-
1.4.7 Others Market Size
-
-
1.5 Global Aqua Feed Market Size By Species Outlook: 2021 - 2033
-
1.5.1 Fish Market Size
-
1.5.2 Crustaceans Market Size
-
1.5.3 Others Market Size
-
-
1.6 Global Aqua Feed Market Size By Form Outlook: for 2021 - 2033
-
1.6.1 Dry Market Size
-
1.6.2 Moist Market Size
-
1.6.3 Wet Market Size
-
-
1.7 Global Aqua Feed Market Size By Lifecycle Outlook: for 2021 - 2033
-
1.7.1 Starter feed Market Size
-
1.7.2 Grower feed Market Size
-
1.7.3 Finisher feed Market Size
-
1.7.4 Brooder feed Market Size
-
-
1.8 Global Level Competitor Analysis (Subject to Data Availability (Private Players))
-
1.9 Executive Summary Global Market (2021 vs 2025 vs 2033)
You can purchase only the Executive Summary of Global Market (2019 vs 2024 vs 2031)
-
1.9.1 Regional Market Revenue Summary 2021 vs 2025 vs 2033
-
1.9.2 Global Market Revenue Split By Ingredients Outlook:
-
1.9.3 Global Market Revenue Split By Additives Outlook:
-
1.9.4 Global Market Revenue Split By Species Outlook:
-
1.9.5 Global Market Revenue Split By Form Outlook:
-
1.9.6 Global Market Revenue Split By Lifecycle Outlook:
-
1.9.7 Global Market Dynamics, Trends, Drivers, Restraints, Opportunities
Global Market Dynamics, Trends, Drivers, Restraints, Opportunities, Only Pointers will be deliverable
-
This chapter will help you gain North America Market Analysis of Aqua Feed. Further deep in this chapter, you will be able to review North America Aqua Feed Market Split by various segments and Country Split.
Chapter 2 North America Market Analysis
-
2.1 North America Aqua Feed Market Size 2021 - 2033
-
2.1.1 North America Aqua Feed Market Size By Country 2021 - 2033
-
2.1.2 North America Aqua Feed Market Size by Ingredients Outlook: 2021 - 2033
-
2.1.2.1 North America Soybean Market Size
-
2.1.2.2 North America Corn Market Size
-
2.1.2.3 North America Fishmeal Market Size
-
2.1.2.4 North America Fish Oil Market Size
-
2.1.2.5 North America Additives Market Size
-
2.1.2.6 North America Others Market Size
-
-
2.1.3 North America Aqua Feed Market Size by Additives Outlook: 2021 - 2033
-
2.1.3.1 North America Antibiotics Market Size
-
2.1.3.2 North America Vitamins & minerals Market Size
-
2.1.3.3 North America Antioxidants Market Size
-
2.1.3.4 North America Amino acids Market Size
-
2.1.3.5 North America Enzymes Market Size
-
2.1.3.6 North America Probiotics & prebiotics Market Size
-
2.1.3.7 North America Others Market Size
-
-
2.1.4 North America Aqua Feed Market Size by Species Outlook: 2021 - 2033
-
2.1.4.1 North America Fish Market Size
-
2.1.4.2 North America Crustaceans Market Size
-
2.1.4.3 North America Others Market Size
-
-
2.1.5 North America Aqua Feed Market Size by Form Outlook: 2021 - 2033
-
2.1.5.1 North America Dry Market Size
-
2.1.5.2 North America Moist Market Size
-
2.1.5.3 North America Wet Market Size
-
-
2.1.6 North America Aqua Feed Market Size by Lifecycle Outlook: 2021 - 2033
-
2.1.6.1 North America Starter feed Market Size
-
2.1.6.2 North America Grower feed Market Size
-
2.1.6.3 North America Finisher feed Market Size
-
2.1.6.4 North America Brooder feed Market Size
-
-
-
2.2 United States Market Size 2021 - 2033
-
2.2.1 United States Aqua Feed Market Size by Ingredients Outlook: 2021 - 2033
-
2.2.2 United States Aqua Feed Market Size by Additives Outlook: 2021 - 2033
-
2.2.3 United States Aqua Feed Market Size by Species Outlook: 2021 - 2033
-
2.2.4 United States Aqua Feed Market Size by Form Outlook: 2021 - 2033
-
2.2.5 United States Aqua Feed Market Size by Lifecycle Outlook: 2021 - 2033
-
-
2.3 Canada Market Size 2021 - 2033
-
2.3.1 Canada Aqua Feed Market Size by Ingredients Outlook: 2021 - 2033
-
2.3.2 Canada Aqua Feed Market Size by Additives Outlook: 2021 - 2033
-
2.3.3 Canada Aqua Feed Market Size by Species Outlook: 2021 - 2033
-
2.3.4 Canada Aqua Feed Market Size by Form Outlook: 2021 - 2033
-
2.3.5 Canada Aqua Feed Market Size by Lifecycle Outlook: 2021 - 2033
-
-
2.4 Mexico Market Size 2021 - 2033
-
2.4.1 Mexico Aqua Feed Market Size by Ingredients Outlook: 2021 - 2033
-
2.4.2 Mexico Aqua Feed Market Size by Additives Outlook: 2021 - 2033
-
2.4.3 Mexico Aqua Feed Market Size by Species Outlook: 2021 - 2033
-
2.4.4 Mexico Aqua Feed Market Size by Form Outlook: 2021 - 2033
-
2.4.5 Mexico Aqua Feed Market Size by Lifecycle Outlook: 2021 - 2033
-
This chapter will help you gain Europe Market Analysis of Aqua Feed. Further deep in this chapter, you will be able to review Europe Aqua Feed Market Split by various segments and Country Split.
Chapter 3 Europe Market Analysis
-
3.1 Europe Aqua Feed Market Size 2021 - 2033
-
3.1.1 Europe Aqua Feed Market Size By Country 2021 - 2033
-
3.1.2 Europe Aqua Feed Market Size by Ingredients Outlook: 2021 - 2033
-
3.1.2.1 Europe Soybean Market Size
-
3.1.2.2 Europe Corn Market Size
-
3.1.2.3 Europe Fishmeal Market Size
-
3.1.2.4 Europe Fish Oil Market Size
-
3.1.2.5 Europe Additives Market Size
-
3.1.2.6 Europe Others Market Size
-
-
3.1.3 Europe Aqua Feed Market Size by Additives Outlook: 2021 - 2033
-
3.1.3.1 Europe Antibiotics Market Size
-
3.1.3.2 Europe Vitamins & minerals Market Size
-
3.1.3.3 Europe Antioxidants Market Size
-
3.1.3.4 Europe Amino acids Market Size
-
3.1.3.5 Europe Enzymes Market Size
-
3.1.3.6 Europe Probiotics & prebiotics Market Size
-
3.1.3.7 Europe Others Market Size
-
-
3.1.4 Europe Aqua Feed Market Size by Species Outlook: 2021 - 2033
-
3.1.4.1 Europe Fish Market Size
-
3.1.4.2 Europe Crustaceans Market Size
-
3.1.4.3 Europe Others Market Size
-
-
3.1.5 Europe Aqua Feed Market Size by Form Outlook: 2021 - 2033
-
3.1.5.1 Europe Dry Market Size
-
3.1.5.2 Europe Moist Market Size
-
3.1.5.3 Europe Wet Market Size
-
-
3.1.6 Europe Aqua Feed Market Size by Lifecycle Outlook: 2021 - 2033
-
3.1.6.1 Europe Starter feed Market Size
-
3.1.6.2 Europe Grower feed Market Size
-
3.1.6.3 Europe Finisher feed Market Size
-
3.1.6.4 Europe Brooder feed Market Size
-
-
-
3.2 United Kingdom Market Size 2021 - 2033
-
3.2.1 United Kingdom Aqua Feed Market Size by Ingredients Outlook: 2021 - 2033
-
3.2.2 United Kingdom Aqua Feed Market Size by Additives Outlook: 2021 - 2033
-
3.2.3 United Kingdom Aqua Feed Market Size by Species Outlook: 2021 - 2033
-
3.2.4 United Kingdom Aqua Feed Market Size by Form Outlook: 2021 - 2033
-
3.2.5 United Kingdom Aqua Feed Market Size by Lifecycle Outlook: 2021 - 2033
-
-
3.3 France Market Size 2021 - 2033
-
3.3.1 France Aqua Feed Market Size by Ingredients Outlook: 2021 - 2033
-
3.3.2 France Aqua Feed Market Size by Additives Outlook: 2021 - 2033
-
3.3.3 France Aqua Feed Market Size by Species Outlook: 2021 - 2033
-
3.3.4 France Aqua Feed Market Size by Form Outlook: 2021 - 2033
-
3.3.5 France Aqua Feed Market Size by Lifecycle Outlook: 2021 - 2033
-
-
3.4 Germany Market Size 2021 - 2033
-
3.4.1 Germany Aqua Feed Market Size by Ingredients Outlook: 2021 - 2033
-
3.4.2 Germany Aqua Feed Market Size by Additives Outlook: 2021 - 2033
-
3.4.3 Germany Aqua Feed Market Size by Species Outlook: 2021 - 2033
-
3.4.4 Germany Aqua Feed Market Size by Form Outlook: 2021 - 2033
-
3.4.5 Germany Aqua Feed Market Size by Lifecycle Outlook: 2021 - 2033
-
-
3.5 Italy Market Size 2021 - 2033
-
3.5.1 Italy Aqua Feed Market Size by Ingredients Outlook: 2021 - 2033
-
3.5.2 Italy Aqua Feed Market Size by Additives Outlook: 2021 - 2033
-
3.5.3 Italy Aqua Feed Market Size by Species Outlook: 2021 - 2033
-
3.5.4 Italy Aqua Feed Market Size by Form Outlook: 2021 - 2033
-
3.5.5 Italy Aqua Feed Market Size by Lifecycle Outlook: 2021 - 2033
-
-
3.6 Russia Market Size 2021 - 2033
-
3.6.1 Russia Aqua Feed Market Size by Ingredients Outlook: 2021 - 2033
-
3.6.2 Russia Aqua Feed Market Size by Additives Outlook: 2021 - 2033
-
3.6.3 Russia Aqua Feed Market Size by Species Outlook: 2021 - 2033
-
3.6.4 Russia Aqua Feed Market Size by Form Outlook: 2021 - 2033
-
3.6.5 Russia Aqua Feed Market Size by Lifecycle Outlook: 2021 - 2033
-
-
3.7 Spain Market Size 2021 - 2033
-
3.7.1 Spain Aqua Feed Market Size by Ingredients Outlook: 2021 - 2033
-
3.7.2 Spain Aqua Feed Market Size by Additives Outlook: 2021 - 2033
-
3.7.3 Spain Aqua Feed Market Size by Species Outlook: 2021 - 2033
-
3.7.4 Spain Aqua Feed Market Size by Form Outlook: 2021 - 2033
-
3.7.5 Spain Aqua Feed Market Size by Lifecycle Outlook: 2021 - 2033
-
-
3.8 Sweden Market Size 2021 - 2033
-
3.8.1 Sweden Aqua Feed Market Size by Ingredients Outlook: 2021 - 2033
-
3.8.2 Sweden Aqua Feed Market Size by Additives Outlook: 2021 - 2033
-
3.8.3 Sweden Aqua Feed Market Size by Species Outlook: 2021 - 2033
-
3.8.4 Sweden Aqua Feed Market Size by Form Outlook: 2021 - 2033
-
3.8.5 Sweden Aqua Feed Market Size by Lifecycle Outlook: 2021 - 2033
-
-
3.9 Denmark Market Size 2021 - 2033
-
3.9.1 Denmark Aqua Feed Market Size by Ingredients Outlook: 2021 - 2033
-
3.9.2 Denmark Aqua Feed Market Size by Additives Outlook: 2021 - 2033
-
3.9.3 Denmark Aqua Feed Market Size by Species Outlook: 2021 - 2033
-
3.9.4 Denmark Aqua Feed Market Size by Form Outlook: 2021 - 2033
-
3.9.5 Denmark Aqua Feed Market Size by Lifecycle Outlook: 2021 - 2033
-
-
3.10 Switzerland Market Size 2021 - 2033
-
3.10.1 Switzerland Aqua Feed Market Size by Ingredients Outlook: 2021 - 2033
-
3.10.2 Switzerland Aqua Feed Market Size by Additives Outlook: 2021 - 2033
-
3.10.3 Switzerland Aqua Feed Market Size by Species Outlook: 2021 - 2033
-
3.10.4 Switzerland Aqua Feed Market Size by Form Outlook: 2021 - 2033
-
3.10.5 Switzerland Aqua Feed Market Size by Lifecycle Outlook: 2021 - 2033
-
-
3.11 Luxembourg Market Size 2021 - 2033
-
3.11.1 Luxembourg Aqua Feed Market Size by Ingredients Outlook: 2021 - 2033
-
3.11.2 Luxembourg Aqua Feed Market Size by Additives Outlook: 2021 - 2033
-
3.11.3 Luxembourg Aqua Feed Market Size by Species Outlook: 2021 - 2033
-
3.11.4 Luxembourg Aqua Feed Market Size by Form Outlook: 2021 - 2033
-
3.11.5 Luxembourg Aqua Feed Market Size by Lifecycle Outlook: 2021 - 2033
-
-
3.12 Rest of Europe Market Size 2021 - 2033
-
3.12.1 Rest of Europe Aqua Feed Market Size by Ingredients Outlook: 2021 - 2033
-
3.12.2 Rest of Europe Aqua Feed Market Size by Additives Outlook: 2021 - 2033
-
3.12.3 Rest of Europe Aqua Feed Market Size by Species Outlook: 2021 - 2033
-
3.12.4 Rest of Europe Aqua Feed Market Size by Form Outlook: 2021 - 2033
-
3.12.5 Rest of Europe Aqua Feed Market Size by Lifecycle Outlook: 2021 - 2033
-
This chapter will help you gain Asia Pacific Market Analysis of Aqua Feed. Further deep in this chapter, you will be able to review Asia Pacific Aqua Feed Market Split by various segments and Country Split.
Chapter 4 Asia Pacific Market Analysis
-
4.1 Asia Pacific Aqua Feed Market Size 2021 - 2033
-
4.1.1 Asia Pacific Aqua Feed Market Size By Country 2021 - 2033
-
4.1.2 Asia Pacific Aqua Feed Market Size by Ingredients Outlook: 2021 - 2033
-
4.1.2.1 Asia Pacific Soybean Market Size
-
4.1.2.2 Asia Pacific Corn Market Size
-
4.1.2.3 Asia Pacific Fishmeal Market Size
-
4.1.2.4 Asia Pacific Fish Oil Market Size
-
4.1.2.5 Asia Pacific Additives Market Size
-
4.1.2.6 Asia Pacific Others Market Size
-
-
4.1.3 Asia Pacific Aqua Feed Market Size by Additives Outlook: 2021 - 2033
-
4.1.3.1 Asia Pacific Antibiotics Market Size
-
4.1.3.2 Asia Pacific Vitamins & minerals Market Size
-
4.1.3.3 Asia Pacific Antioxidants Market Size
-
4.1.3.4 Asia Pacific Amino acids Market Size
-
4.1.3.5 Asia Pacific Enzymes Market Size
-
4.1.3.6 Asia Pacific Probiotics & prebiotics Market Size
-
4.1.3.7 Asia Pacific Others Market Size
-
-
4.1.4 Asia Pacific Aqua Feed Market Size by Species Outlook: 2021 - 2033
-
4.1.4.1 Asia Pacific Fish Market Size
-
4.1.4.2 Asia Pacific Crustaceans Market Size
-
4.1.4.3 Asia Pacific Others Market Size
-
-
4.1.5 Asia Pacific Aqua Feed Market Size by Form Outlook: 2021 - 2033
-
4.1.5.1 Asia Pacific Dry Market Size
-
4.1.5.2 Asia Pacific Moist Market Size
-
4.1.5.3 Asia Pacific Wet Market Size
-
-
4.1.6 Asia Pacific Aqua Feed Market Size by Lifecycle Outlook: 2021 - 2033
-
4.1.6.1 Asia Pacific Starter feed Market Size
-
4.1.6.2 Asia Pacific Grower feed Market Size
-
4.1.6.3 Asia Pacific Finisher feed Market Size
-
4.1.6.4 Asia Pacific Brooder feed Market Size
-
-
-
4.2 China Aqua Feed Market Size 2021 - 2033
-
4.2.1 China Aqua Feed Market Size by Ingredients Outlook: 2021 - 2033
-
4.2.2 China Aqua Feed Market Size by Additives Outlook: 2021 - 2033
-
4.2.3 China Aqua Feed Market Size by Species Outlook: 2021 - 2033
-
4.2.4 China Aqua Feed Market Size by Form Outlook: 2021 - 2033
-
4.2.5 China Aqua Feed Market Size by Lifecycle Outlook: 2021 - 2033
-
-
4.3 Japan Aqua Feed Market Size 2021 - 2033
-
4.3.1 Japan Aqua Feed Market Size by Ingredients Outlook: 2021 - 2033
-
4.3.2 Japan Aqua Feed Market Size by Additives Outlook: 2021 - 2033
-
4.3.3 Japan Aqua Feed Market Size by Species Outlook: 2021 - 2033
-
4.3.4 Japan Aqua Feed Market Size by Form Outlook: 2021 - 2033
-
4.3.5 Japan Aqua Feed Market Size by Lifecycle Outlook: 2021 - 2033
-
-
4.4 South Korea Aqua Feed Market Size 2021 - 2033
-
4.4.1 South Korea Aqua Feed Market Size by Ingredients Outlook: 2021 - 2033
-
4.4.2 South Korea Aqua Feed Market Size by Additives Outlook: 2021 - 2033
-
4.4.3 South Korea Aqua Feed Market Size by Species Outlook: 2021 - 2033
-
4.4.4 South Korea Aqua Feed Market Size by Form Outlook: 2021 - 2033
-
4.4.5 South Korea Aqua Feed Market Size by Lifecycle Outlook: 2021 - 2033
-
-
4.5 India Aqua Feed Market Size 2021 - 2033
-
4.5.1 India Aqua Feed Market Size by Ingredients Outlook: 2021 - 2033
-
4.5.2 India Aqua Feed Market Size by Additives Outlook: 2021 - 2033
-
4.5.3 India Aqua Feed Market Size by Species Outlook: 2021 - 2033
-
4.5.4 India Aqua Feed Market Size by Form Outlook: 2021 - 2033
-
4.5.5 India Aqua Feed Market Size by Lifecycle Outlook: 2021 - 2033
-
-
4.6 Australia Aqua Feed Market Size 2021 - 2033
-
4.6.1 Australia Aqua Feed Market Size by Ingredients Outlook: 2021 - 2033
-
4.6.2 Australia Aqua Feed Market Size by Additives Outlook: 2021 - 2033
-
4.6.3 Australia Aqua Feed Market Size by Species Outlook: 2021 - 2033
-
4.6.4 Australia Aqua Feed Market Size by Form Outlook: 2021 - 2033
-
4.6.5 Australia Aqua Feed Market Size by Lifecycle Outlook: 2021 - 2033
-
-
4.7 Singapore Aqua Feed Market Size 2021 - 2033
-
4.7.1 Singapore Aqua Feed Market Size by Ingredients Outlook: 2021 - 2033
-
4.7.2 Singapore Aqua Feed Market Size by Additives Outlook: 2021 - 2033
-
4.7.3 Singapore Aqua Feed Market Size by Species Outlook: 2021 - 2033
-
4.7.4 Singapore Aqua Feed Market Size by Form Outlook: 2021 - 2033
-
4.7.5 Singapore Aqua Feed Market Size by Lifecycle Outlook: 2021 - 2033
-
-
4.8 Taiwan Aqua Feed Market Size 2021 - 2033
-
4.8.1 Taiwan Aqua Feed Market Size by Ingredients Outlook: 2021 - 2033
-
4.8.2 Taiwan Aqua Feed Market Size by Additives Outlook: 2021 - 2033
-
4.8.3 Taiwan Aqua Feed Market Size by Species Outlook: 2021 - 2033
-
4.8.4 Taiwan Aqua Feed Market Size by Form Outlook: 2021 - 2033
-
4.8.5 Taiwan Aqua Feed Market Size by Lifecycle Outlook: 2021 - 2033
-
-
4.9 South East Asia Aqua Feed Market Size 2021 - 2033
-
4.9.1 South East Asia Aqua Feed Market Size by Ingredients Outlook: 2021 - 2033
-
4.9.2 South East Asia Aqua Feed Market Size by Additives Outlook: 2021 - 2033
-
4.9.3 South East Asia Aqua Feed Market Size by Species Outlook: 2021 - 2033
-
4.9.4 South East Asia Aqua Feed Market Size by Form Outlook: 2021 - 2033
-
4.9.5 South East Asia Aqua Feed Market Size by Lifecycle Outlook: 2021 - 2033
-
-
4.10 Rest of APAC Aqua Feed Market Size 2021 - 2033
-
4.10.1 Rest of APAC Aqua Feed Market Size by Ingredients Outlook: 2021 - 2033
-
4.10.2 Rest of APAC Aqua Feed Market Size by Additives Outlook: 2021 - 2033
-
4.10.3 Rest of APAC Aqua Feed Market Size by Species Outlook: 2021 - 2033
-
4.10.4 Rest of APAC Aqua Feed Market Size by Form Outlook: 2021 - 2033
-
4.10.5 Rest of APAC Aqua Feed Market Size by Lifecycle Outlook: 2021 - 2033
-
This chapter will help you gain South America Market Analysis of Aqua Feed. Further deep in this chapter, you will be able to review South America Aqua Feed Market Split by various segments and Country Split.
Chapter 5 South America Market Analysis
-
5.1 South America Aqua Feed Market Size 2021 - 2033
-
5.1.1 South America Aqua Feed Market Size By Country 2021 - 2033
-
5.1.2 South America Aqua Feed Market Size by Ingredients Outlook: 2021 - 2033
-
5.1.2.1 South America Soybean Market Size
-
5.1.2.2 South America Corn Market Size
-
5.1.2.3 South America Fishmeal Market Size
-
5.1.2.4 South America Fish Oil Market Size
-
5.1.2.5 South America Additives Market Size
-
5.1.2.6 South America Others Market Size
-
-
5.1.3 South America Aqua Feed Market Size by Additives Outlook: 2021 - 2033
-
5.1.3.1 South America Antibiotics Market Size
-
5.1.3.2 South America Vitamins & minerals Market Size
-
5.1.3.3 South America Antioxidants Market Size
-
5.1.3.4 South America Amino acids Market Size
-
5.1.3.5 South America Enzymes Market Size
-
5.1.3.6 South America Probiotics & prebiotics Market Size
-
5.1.3.7 South America Others Market Size
-
-
5.1.4 South America Aqua Feed Market Size by Species Outlook: 2021 - 2033
-
5.1.4.1 South America Fish Market Size
-
5.1.4.2 South America Crustaceans Market Size
-
5.1.4.3 South America Others Market Size
-
-
5.1.5 South America Aqua Feed Market Size by Form Outlook: 2021 - 2033
-
5.1.5.1 South America Dry Market Size
-
5.1.5.2 South America Moist Market Size
-
5.1.5.3 South America Wet Market Size
-
-
5.1.6 South America Aqua Feed Market Size by Lifecycle Outlook: 2021 - 2033
-
5.1.6.1 South America Starter feed Market Size
-
5.1.6.2 South America Grower feed Market Size
-
5.1.6.3 South America Finisher feed Market Size
-
5.1.6.4 South America Brooder feed Market Size
-
-
-
5.2 Brazil Aqua Feed Market Size 2021 - 2033
-
5.2.1 Brazil Aqua Feed Market Size by Ingredients Outlook: 2021 - 2033
-
5.2.2 Brazil Aqua Feed Market Size by Additives Outlook: 2021 - 2033
-
5.2.3 Brazil Aqua Feed Market Size by Species Outlook: 2021 - 2033
-
5.2.4 Brazil Aqua Feed Market Size by Form Outlook: 2021 - 2033
-
5.2.5 Brazil Aqua Feed Market Size by Lifecycle Outlook: 2021 - 2033
-
-
5.3 Argentina Aqua Feed Market Size 2021 - 2033
-
5.3.1 Argentina Aqua Feed Market Size by Ingredients Outlook: 2021 - 2033
-
5.3.2 Argentina Aqua Feed Market Size by Additives Outlook: 2021 - 2033
-
5.3.3 Argentina Aqua Feed Market Size by Species Outlook: 2021 - 2033
-
5.3.4 Argentina Aqua Feed Market Size by Form Outlook: 2021 - 2033
-
5.3.5 Argentina Aqua Feed Market Size by Lifecycle Outlook: 2021 - 2033
-
-
5.4 Colombia Aqua Feed Market Size 2021 - 2033
-
5.4.1 Colombia Aqua Feed Market Size by Ingredients Outlook: 2021 - 2033
-
5.4.2 Colombia Aqua Feed Market Size by Additives Outlook: 2021 - 2033
-
5.4.3 Colombia Aqua Feed Market Size by Species Outlook: 2021 - 2033
-
5.4.4 Colombia Aqua Feed Market Size by Form Outlook: 2021 - 2033
-
5.4.5 Colombia Aqua Feed Market Size by Lifecycle Outlook: 2021 - 2033
-
-
5.5 Peru Aqua Feed Market Size 2021 - 2033
-
5.5.1 Peru Aqua Feed Market Size by Ingredients Outlook: 2021 - 2033
-
5.5.2 Peru Aqua Feed Market Size by Additives Outlook: 2021 - 2033
-
5.5.3 Peru Aqua Feed Market Size by Species Outlook: 2021 - 2033
-
5.5.4 Peru Aqua Feed Market Size by Form Outlook: 2021 - 2033
-
5.5.5 Peru Aqua Feed Market Size by Lifecycle Outlook: 2021 - 2033
-
-
5.6 Chile Aqua Feed Market Size 2021 - 2033
-
5.6.1 Chile Aqua Feed Market Size by Ingredients Outlook: 2021 - 2033
-
5.6.2 Chile Aqua Feed Market Size by Additives Outlook: 2021 - 2033
-
5.6.3 Chile Aqua Feed Market Size by Species Outlook: 2021 - 2033
-
5.6.4 Chile Aqua Feed Market Size by Form Outlook: 2021 - 2033
-
5.6.5 Chile Aqua Feed Market Size by Lifecycle Outlook: 2021 - 2033
-
-
5.7 Rest of South America Aqua Feed Market Size 2021 - 2033
-
5.7.1 Rest of South America Aqua Feed Market Size by Ingredients Outlook: 2021 - 2033
-
5.7.2 Rest of South America Aqua Feed Market Size by Additives Outlook: 2021 - 2033
-
5.7.3 Rest of South America Aqua Feed Market Size by Species Outlook: 2021 - 2033
-
5.7.4 Rest of South America Aqua Feed Market Size by Form Outlook: 2021 - 2033
-
5.7.5 Rest of South America Aqua Feed Market Size by Lifecycle Outlook: 2021 - 2033
-
This chapter will help you gain Middle East Market Analysis of Aqua Feed. Further deep in this chapter, you will be able to review Middle East Aqua Feed Market Split by various segments and Country Split.
Chapter 6 Middle East Market Analysis
-
6.1 Middle East Aqua Feed Market Size 2021 - 2033
-
6.1.1 Middle East Aqua Feed Market Size By Country 2021 - 2033
-
6.1.2 Middle East Aqua Feed Market Size by Ingredients Outlook: 2021 - 2033
-
6.1.2.1 Middle East Soybean Market Size
-
6.1.2.2 Middle East Corn Market Size
-
6.1.2.3 Middle East Fishmeal Market Size
-
6.1.2.4 Middle East Fish Oil Market Size
-
6.1.2.5 Middle East Additives Market Size
-
6.1.2.6 Middle East Others Market Size
-
-
6.1.3 Middle East Aqua Feed Market Size by Additives Outlook: 2021 - 2033
-
6.1.3.1 Middle East Antibiotics Market Size
-
6.1.3.2 Middle East Vitamins & minerals Market Size
-
6.1.3.3 Middle East Antioxidants Market Size
-
6.1.3.4 Middle East Amino acids Market Size
-
6.1.3.5 Middle East Enzymes Market Size
-
6.1.3.6 Middle East Probiotics & prebiotics Market Size
-
6.1.3.7 Middle East Others Market Size
-
-
6.1.4 Middle East Aqua Feed Market Size by Species Outlook: 2021 - 2033
-
6.1.4.1 Middle East Fish Market Size
-
6.1.4.2 Middle East Crustaceans Market Size
-
6.1.4.3 Middle East Others Market Size
-
-
6.1.5 Middle East Aqua Feed Market Size by Form Outlook: 2021 - 2033
-
6.1.5.1 Middle East Dry Market Size
-
6.1.5.2 Middle East Moist Market Size
-
6.1.5.3 Middle East Wet Market Size
-
-
6.1.6 Middle East Aqua Feed Market Size by Lifecycle Outlook: 2021 - 2033
-
6.1.6.1 Middle East Starter feed Market Size
-
6.1.6.2 Middle East Grower feed Market Size
-
6.1.6.3 Middle East Finisher feed Market Size
-
6.1.6.4 Middle East Brooder feed Market Size
-
-
-
6.2 Saudi Arabia Aqua Feed Market Size 2021 - 2033
-
6.2.1 Saudi Arabia Aqua Feed Market Size by Ingredients Outlook: 2021 - 2033
-
6.2.2 Saudi Arabia Aqua Feed Market Size by Additives Outlook: 2021 - 2033
-
6.2.3 Saudi Arabia Aqua Feed Market Size by Species Outlook: 2021 - 2033
-
6.2.4 Saudi Arabia Aqua Feed Market Size by Form Outlook: 2021 - 2033
-
6.2.5 Saudi Arabia Aqua Feed Market Size by Lifecycle Outlook: 2021 - 2033
-
-
6.3 Turkey Aqua Feed Market Size 2021 - 2033
-
6.3.1 Turkey Aqua Feed Market Size by Ingredients Outlook: 2021 - 2033
-
6.3.2 Turkey Aqua Feed Market Size by Additives Outlook: 2021 - 2033
-
6.3.3 Turkey Aqua Feed Market Size by Species Outlook: 2021 - 2033
-
6.3.4 Turkey Aqua Feed Market Size by Form Outlook: 2021 - 2033
-
6.3.5 Turkey Aqua Feed Market Size by Lifecycle Outlook: 2021 - 2033
-
-
6.4 UAE Aqua Feed Market Size 2021 - 2033
-
6.4.1 UAE Aqua Feed Market Size by Ingredients Outlook: 2021 - 2033
-
6.4.2 UAE Aqua Feed Market Size by Additives Outlook: 2021 - 2033
-
6.4.3 UAE Aqua Feed Market Size by Species Outlook: 2021 - 2033
-
6.4.4 UAE Aqua Feed Market Size by Form Outlook: 2021 - 2033
-
6.4.5 UAE Aqua Feed Market Size by Lifecycle Outlook: 2021 - 2033
-
-
6.5 Egypt Aqua Feed Market Size 2021 - 2033
-
6.5.1 Egypt Aqua Feed Market Size by Ingredients Outlook: 2021 - 2033
-
6.5.2 Egypt Aqua Feed Market Size by Additives Outlook: 2021 - 2033
-
6.5.3 Egypt Aqua Feed Market Size by Species Outlook: 2021 - 2033
-
6.5.4 Egypt Aqua Feed Market Size by Form Outlook: 2021 - 2033
-
6.5.5 Egypt Aqua Feed Market Size by Lifecycle Outlook: 2021 - 2033
-
-
6.6 Qatar Aqua Feed Market Size 2021 - 2033
-
6.6.1 Qatar Aqua Feed Market Size by Ingredients Outlook: 2021 - 2033
-
6.6.2 Qatar Aqua Feed Market Size by Additives Outlook: 2021 - 2033
-
6.6.3 Qatar Aqua Feed Market Size by Species Outlook: 2021 - 2033
-
6.6.4 Qatar Aqua Feed Market Size by Form Outlook: 2021 - 2033
-
6.6.5 Qatar Aqua Feed Market Size by Lifecycle Outlook: 2021 - 2033
-
-
6.7 Rest of Middle East Aqua Feed Market Size 2021 - 2033
-
6.7.1 Rest of Middle East Aqua Feed Market Size by Ingredients Outlook: 2021 - 2033
-
6.7.2 Rest of Middle East Aqua Feed Market Size by Additives Outlook: 2021 - 2033
-
6.7.3 Rest of Middle East Aqua Feed Market Size by Species Outlook: 2021 - 2033
-
6.7.4 Rest of Middle East Aqua Feed Market Size by Form Outlook: 2021 - 2033
-
6.7.5 Rest of Middle East Aqua Feed Market Size by Lifecycle Outlook: 2021 - 2033
-
This chapter will help you gain Middle East Market Analysis of Aqua Feed. Further deep in this chapter, you will be able to review Middle East Aqua Feed Market Split by various segments and Country Split.
Chapter 7 Africa Market Analysis
-
7.1 Africa Aqua Feed Market Size 2021 - 2033
-
7.1.1 Africa Aqua Feed Market Size By Country 2021 - 2033
-
7.1.2 Africa Aqua Feed Market Size by Ingredients Outlook: 2021 - 2033
-
7.1.2.1 Africa Soybean Market Size
-
7.1.2.2 Africa Corn Market Size
-
7.1.2.3 Africa Fishmeal Market Size
-
7.1.2.4 Africa Fish Oil Market Size
-
7.1.2.5 Africa Additives Market Size
-
7.1.2.6 Africa Others Market Size
-
-
7.1.3 Africa Aqua Feed Market Size by Additives Outlook: 2021 - 2033
-
7.1.3.1 Africa Antibiotics Market Size
-
7.1.3.2 Africa Vitamins & minerals Market Size
-
7.1.3.3 Africa Antioxidants Market Size
-
7.1.3.4 Africa Amino acids Market Size
-
7.1.3.5 Africa Enzymes Market Size
-
7.1.3.6 Africa Probiotics & prebiotics Market Size
-
7.1.3.7 Africa Others Market Size
-
-
7.1.4 Africa Aqua Feed Market Size by Species Outlook: 2021 - 2033
-
7.1.4.1 Africa Fish Market Size
-
7.1.4.2 Africa Crustaceans Market Size
-
7.1.4.3 Africa Others Market Size
-
-
7.1.5 Africa Aqua Feed Market Size by Form Outlook: 2021 - 2033
-
7.1.5.1 Africa Dry Market Size
-
7.1.5.2 Africa Moist Market Size
-
7.1.5.3 Africa Wet Market Size
-
-
7.1.6 Africa Aqua Feed Market Size by Lifecycle Outlook: 2021 - 2033
-
7.1.6.1 Africa Starter feed Market Size
-
7.1.6.2 Africa Grower feed Market Size
-
7.1.6.3 Africa Finisher feed Market Size
-
7.1.6.4 Africa Brooder feed Market Size
-
-
-
7.2 Nigeria Aqua Feed Market Size 2021 - 2033
-
7.2.1 Nigeria Aqua Feed Market Size by Ingredients Outlook: 2021 - 2033
-
7.2.2 Nigeria Aqua Feed Market Size by Additives Outlook: 2021 - 2033
-
7.2.3 Nigeria Aqua Feed Market Size by Species Outlook: 2021 - 2033
-
7.2.4 Nigeria Aqua Feed Market Size by Form Outlook: 2021 - 2033
-
7.2.5 Nigeria Aqua Feed Market Size by Lifecycle Outlook: 2021 - 2033
-
-
7.3 South Africa Aqua Feed Market Size 2021 - 2033
-
7.3.1 South Africa Aqua Feed Market Size by Ingredients Outlook: 2021 - 2033
-
7.3.2 South Africa Aqua Feed Market Size by Additives Outlook: 2021 - 2033
-
7.3.3 South Africa Aqua Feed Market Size by Species Outlook: 2021 - 2033
-
7.3.4 South Africa Aqua Feed Market Size by Form Outlook: 2021 - 2033
-
7.3.5 South Africa Aqua Feed Market Size by Lifecycle Outlook: 2021 - 2033
-
-
7.4 Rest of Africa Aqua Feed Market Size 2021 - 2033
-
7.4.1 Rest of Africa Aqua Feed Market Size by Ingredients Outlook: 2021 - 2033
-
7.4.2 Rest of Africa Aqua Feed Market Size by Additives Outlook: 2021 - 2033
-
7.4.3 Rest of Africa Aqua Feed Market Size by Species Outlook: 2021 - 2033
-
7.4.4 Rest of Africa Aqua Feed Market Size by Form Outlook: 2021 - 2033
-
7.4.5 Rest of Africa Aqua Feed Market Size by Lifecycle Outlook: 2021 - 2033
-
This chapter provides an in-depth analysis of the market share among key competitors of Aqua Feed. The analysis highlights each competitor's position in the market, growth trends, and financial performance, offering insights into competitive dynamics, and emerging players.
Chapter 8 Competitor Analysis (Subject to Data Availability (Private Players))
-
8.1 Top Competitors Analysis
-
8.1.1 Top Players Ranking 2024
-
8.1.2 Global Aqua Feed Market Revenue and Share by Key Players
(Subject to Data Availability (Private Players))
-
8.1.3 Industry Mergers and Acquisition Analysis
-
8.1.4 New Product Launch Analysis
-
-
8.2 Company Profile (Data Subject to Availability) Sample Format
-
8.2.1 Cargill Incorporated (Minnesota U.S.)
Data Subject to Availability as we consider Top competitors and their market share will be delivered.
-
8.2.1.1 Company Basic Information, Manufacturing Base, Sales Area, and Competitors
-
8.2.1.2 Business Overview
-
8.2.1.3 Financials (Subject to data availability)
-
8.2.1.4 Product Types Specification
-
8.2.1.5 Business Strategy
-
8.2.1.6 S.W.O.TAnalysis
-
-
8.2.2 Archer Daniels Midland Company (Illinois U.S.)
Data Subject to Availability as we consider Top competitors and their market share will be delivered.
-
8.2.2.1 Company Basic Information, Manufacturing Base, Sales Area, and Competitors
-
8.2.2.2 Business Overview
-
8.2.2.3 Financials (Subject to data availability)
-
8.2.2.4 Product Types Specification
-
8.2.2.5 Business Strategy
-
8.2.2.6 S.W.O.TAnalysis
-
-
8.2.3 Alltech Inc. (U.S.)
Data Subject to Availability as we consider Top competitors and their market share will be delivered.
-
8.2.3.1 Company Basic Information, Manufacturing Base, Sales Area, and Competitors
-
8.2.3.2 Business Overview
-
8.2.3.3 Financials (Subject to data availability)
-
8.2.3.4 Product Types Specification
-
8.2.3.5 Business Strategy
-
8.2.3.6 S.W.O.TAnalysis
-
-
8.2.4 Purina Animal Nutrition (Missouri U.S.)
Data Subject to Availability as we consider Top competitors and their market share will be delivered.
-
8.2.4.1 Company Basic Information, Manufacturing Base, Sales Area, and Competitors
-
8.2.4.2 Business Overview
-
8.2.4.3 Financials (Subject to data availability)
-
8.2.4.4 Product Types Specification
-
8.2.4.5 Business Strategy
-
8.2.4.6 S.W.O.TAnalysis
-
-
8.2.5 Ridley Corp Ltd (Australia)
Data Subject to Availability as we consider Top competitors and their market share will be delivered.
-
8.2.5.1 Company Basic Information, Manufacturing Base, Sales Area, and Competitors
-
8.2.5.2 Business Overview
-
8.2.5.3 Financials (Subject to data availability)
-
8.2.5.4 Product Types Specification
-
8.2.5.5 Business Strategy
-
8.2.5.6 S.W.O.TAnalysis
-
-
8.2.6 Nutreco N.V. (Amersfoort Netherlands)
Data Subject to Availability as we consider Top competitors and their market share will be delivered.
-
8.2.6.1 Company Basic Information, Manufacturing Base, Sales Area, and Competitors
-
8.2.6.2 Business Overview
-
8.2.6.3 Financials (Subject to data availability)
-
8.2.6.4 Product Types Specification
-
8.2.6.5 Business Strategy
-
8.2.6.6 S.W.O.TAnalysis
-
-
8.2.7 Aller Aqua A/S (Christiansfeld Denmark)
Data Subject to Availability as we consider Top competitors and their market share will be delivered.
-
8.2.7.1 Company Basic Information, Manufacturing Base, Sales Area, and Competitors
-
8.2.7.2 Business Overview
-
8.2.7.3 Financials (Subject to data availability)
-
8.2.7.4 Product Types Specification
-
8.2.7.5 Business Strategy
-
8.2.7.6 S.W.O.TAnalysis
-
-
8.2.8 BioMar A/S (Denmark)
Data Subject to Availability as we consider Top competitors and their market share will be delivered.
-
8.2.8.1 Company Basic Information, Manufacturing Base, Sales Area, and Competitors
-
8.2.8.2 Business Overview
-
8.2.8.3 Financials (Subject to data availability)
-
8.2.8.4 Product Types Specification
-
8.2.8.5 Business Strategy
-
8.2.8.6 S.W.O.TAnalysis
-
-
8.2.9 Dibaq Aquaculture (Spain)
Data Subject to Availability as we consider Top competitors and their market share will be delivered.
-
8.2.9.1 Company Basic Information, Manufacturing Base, Sales Area, and Competitors
-
8.2.9.2 Business Overview
-
8.2.9.3 Financials (Subject to data availability)
-
8.2.9.4 Product Types Specification
-
8.2.9.5 Business Strategy
-
8.2.9.6 S.W.O.TAnalysis
-
-
8.2.10 Beneo GmbH (Germany)
Data Subject to Availability as we consider Top competitors and their market share will be delivered.
-
8.2.10.1 Company Basic Information, Manufacturing Base, Sales Area, and Competitors
-
8.2.10.2 Business Overview
-
8.2.10.3 Financials (Subject to data availability)
-
8.2.10.4 Product Types Specification
-
8.2.10.5 Business Strategy
-
8.2.10.6 S.W.O.TAnalysis
-
-
This chapter would comprehensively cover market drivers, trends, restraints, opportunities, and various in-depth analyses like industrial chain, PESTEL, Porter’s Five Forces, and ESG, among others. It would also include product life cycle, technological advancements, and patent insights.
Chapter 9 Qualitative Analysis (Subject to Data Availability)
-
9.1 Impact of Trump's Tariff War on Aqua Feed Market Data
-
9.1.1 Policy Shifts That Influence the Aqua Feed Market
-
9.1.2 Tariff and their Long-Term Impact on the Aqua Feed Market
-
9.1.3 Trade Wars and Supply Chain Changes in the Aqua Feed Market
-
9.1.4 Regional and Geopolitical implications in the Aqua Feed Market
-
9.1.5 Tax Reforms and Business Expansion in the Aqua Feed Market
-
9.1.6 Investor Sentiment in Key Segments of the Aqua Feed Market
-
9.1.7 Environmental Rollbacks and ESG Implications in the Aqua Feed Market
-
9.1.8 Consumer Behavior and Brand Perception in the Politicized in Aqua Feed Market
-
9.1.9 Strategic takeaways for future administration in Aqua Feed Market
-
-
9.2 Market Drivers
-
9.3 Market Restraints
-
9.4 Market Trends
-
9.5 Market Opportunity
-
9.6 Technological Road Map (Subject to Data Availability)
-
9.7 Product Life Cycle (Subject to Data Availability)
-
9.8 Consumer Preference Analysis
-
9.9 Market Attractiveness Analysis
-
9.10 PESTEL Analysis
-
9.10.1 Political Factors
-
9.10.2 Economic Factors
-
9.10.3 Social Factors
-
9.10.4 Technological Factors
-
9.10.5 Legal Factors
-
9.10.6 Environmental Factors
-
-
9.11 Industrial Chain Analysis (Subject to Data Availability)
-
9.11.1 Industry Chain Analysis
-
9.11.2 Manufacturing Cost Analysis
-
9.11.3 Supply Side Analysis
-
9.11.3.1 Raw Material Analysis
-
9.11.3.2 Raw Material Procurement Analysis
-
9.11.3.3 Raw Material Price Trend Analysis
-
-
-
9.12 Porter’s Five Forces Analysis
-
9.12.1 Bargaining Power of Suppliers
-
9.12.2 Bargaining Power of Buyers
-
9.12.3 Threat of New Entrants
-
9.12.4 Threat of Substitutes
-
9.12.5 Degree of Competition
-
-
9.13 Patent Analysis (Subject to Data Availability)
-
9.14 ESG Analysis
Segmentation Ingredients Outlook: Analysis 2019 -2031, will provide market size split by Ingredients Outlook:. This Information is provided at Global Level, Regional Level and Top Countries Level The report with the segmentation perspective mentioned under this chapters will be delivered to you On Demand. So please let us know if you would like to receive this additional data as well. No additional cost will be applicable for the same.
Chapter 10 Market Split by Ingredients Outlook: Analysis 2021 - 2033
-
10.1 Soybean
-
10.1.1 Global Aqua Feed Revenue Market Size and Share by Soybean 2021 - 2033
-
-
10.2 Corn
-
10.2.1 Global Aqua Feed Revenue Market Size and Share by Corn 2021 - 2033
-
-
10.3 Fishmeal
-
10.3.1 Global Aqua Feed Revenue Market Size and Share by Fishmeal 2021 - 2033
-
-
10.4 Fish Oil
-
10.4.1 Global Aqua Feed Revenue Market Size and Share by Fish Oil 2021 - 2033
-
-
10.5 Additives
-
10.5.1 Global Aqua Feed Revenue Market Size and Share by Additives 2021 - 2033
-
-
10.6 Others
-
10.6.1 Global Aqua Feed Revenue Market Size and Share by Others 2021 - 2033
-
The report with the segmentation perspective mentioned under this chapters will be delivered to you On Demand. So please let us know if you would like to receive this additional data as well. No additional cost will be applicable for the same.
Chapter 11 Market Split by Additives Outlook: Analysis 2021 - 2033
-
11.1 Antibiotics
-
11.1.1 Global Aqua Feed Revenue Market Size and Share by Antibiotics 2021 - 2033
-
-
11.2 Vitamins & minerals
-
11.2.1 Global Aqua Feed Revenue Market Size and Share by Vitamins & minerals 2021 - 2033
-
-
11.3 Antioxidants
-
11.3.1 Global Aqua Feed Revenue Market Size and Share by Antioxidants 2021 - 2033
-
-
11.4 Amino acids
-
11.4.1 Global Aqua Feed Revenue Market Size and Share by Amino acids 2021 - 2033
-
-
11.5 Enzymes
-
11.5.1 Global Aqua Feed Revenue Market Size and Share by Enzymes 2021 - 2033
-
-
11.6 Probiotics & prebiotics
-
11.6.1 Global Aqua Feed Revenue Market Size and Share by Probiotics & prebiotics 2021 - 2033
-
-
11.7 Others
-
11.7.1 Global Aqua Feed Revenue Market Size and Share by Others 2021 - 2033
-
The report with the segmentation perspective mentioned under this chapters will be delivered to you On Demand. So please let us know if you would like to receive this additional data as well. No additional cost will be applicable for the same.
Chapter 12 Market Split by Species Outlook: Analysis 2021 - 2033
-
12.1 Fish
-
12.1.1 Global Aqua Feed Revenue Market Size and Share by Fish 2021 - 2033
-
-
12.2 Crustaceans
-
12.2.1 Global Aqua Feed Revenue Market Size and Share by Crustaceans 2021 - 2033
-
-
12.3 Others
-
12.3.1 Global Aqua Feed Revenue Market Size and Share by Others 2021 - 2033
-
The report with the segmentation perspective mentioned under this chapters will be delivered to you On Demand. So please let us know if you would like to receive this additional data as well. No additional cost will be applicable for the same.
Chapter 13 Market Split by Form Outlook: Analysis 2021 - 2033
-
13.1 Dry
-
13.1.1 Global Aqua Feed Revenue Market Size and Share by Dry 2021 - 2033
-
-
13.2 Moist
-
13.2.1 Global Aqua Feed Revenue Market Size and Share by Moist 2021 - 2033
-
-
13.3 Wet
-
13.3.1 Global Aqua Feed Revenue Market Size and Share by Wet 2021 - 2033
-
The report with the segmentation perspective mentioned under this chapters will be delivered to you On Demand. So please let us know if you would like to receive this additional data as well. No additional cost will be applicable for the same.
Chapter 14 Market Split by Lifecycle Outlook: Analysis 2021 - 2033
-
14.1 Starter feed
-
14.1.1 Global Aqua Feed Revenue Market Size and Share by Starter feed 2021 - 2033
-
-
14.2 Grower feed
-
14.2.1 Global Aqua Feed Revenue Market Size and Share by Grower feed 2021 - 2033
-
-
14.3 Finisher feed
-
14.3.1 Global Aqua Feed Revenue Market Size and Share by Finisher feed 2021 - 2033
-
-
14.4 Brooder feed
-
14.4.1 Global Aqua Feed Revenue Market Size and Share by Brooder feed 2021 - 2033
-
This chapter helps you understand the Key Takeaways and Analyst Point of View of the global Aqua Feed market
Chapter 15 Research Findings
-
15.1 Key Takeaways
-
15.2 Analyst Point of View
Here the analyst will summarize the content of entire report and will share his view point on the current industry scenario and how the market is expected to perform in the near future. The points shared by the analyst are based on his/her detailed in-depth understanding of the market during the course of this report study. You will be provided exclusive rights to interact with the concerned analyst for unlimited time pre purchase as well as post purchase of the report.
-
15.3 Assumptions and Acronyms
Chapter 16 Research Methodology and Sources
-
16.1 Primary Data Collection
-
16.1.1 Steps for Primary Data Collection
-
16.1.1.1 Identification of KOL
-
-
16.1.2 Backward Integration
-
16.1.3 Forward Integration
-
16.1.4 How Primary Research Help Us
-
16.1.5 Modes of Primary Research
-
-
16.2 Secondary Research
-
16.2.1 How Secondary Research Help Us
-
16.2.2 Sources of Secondary Research
-
-
16.3 Data Validation
-
16.3.1 Data Triangulation
-
16.3.2 Top Down & Bottom Up Approach
-
16.3.3 Cross check KOL Responses with Secondary Data
-
-
16.4 Data Representation
Sample Format of Deliverables
The Tables, Graphs/Charts are only for representative purposes and do not depict actual statistics. Purchase full Report access to actual data.
Qualitative Analysis
Research Methodology Implemented by Pratik Shirsath and Team
- 1 Data Gathering
- 1.1 Primary Research
- 1.1.1 Steps for Primary Data Collection
- 1.1.1.1 Identification of KOL
- 1.1.1.2 Backward Integration
- 1.1.1.3 Forward Integration
- 1.1.1.4 How Primary Research Help Us
- 1.1.1.5 Modes of Primary Research
- 1.1.1 Steps for Primary Data Collection
- 1.2 Secondary Research
- 1.2.1 How Secondary Research Help Us
- 1.2.2 Sources of Secondary Research
- 1.1 Primary Research
- 2 Data Validation
- 2.1 Cross check KOL Responses with Secondary Data
- 2.2 Top Down & Bottom Up Approach
- 2.3 Data Triangulation
- 3 Data Representation
Key Questions Answered By Aqua Feed Market Report 2025
| Why Soybean have a significant impact on Aqua Feed market? |
| What are the key factors affecting the Soybean and Corn of Aqua Feed Market? |
| What is the CAGR/Growth Rate of Antibiotics during the forecast period? |
| By type, which segment accounted for largest share of the global Aqua Feed Market? |
| Which region is expected to dominate the global Aqua Feed Market within the forecast period? |
| Segmentation Level Customization |
|
| Global level Data Customization |
|
| Region level Data Customization |
|
| Country level Data Customization |
|
| Company Level |
|
| Additional Data Analysis |
|
| Additional Qualitative Data |
|
| Additional Quantitative Data |
|
| Service Level Customization |
|
Report Format Alteration |
|
