

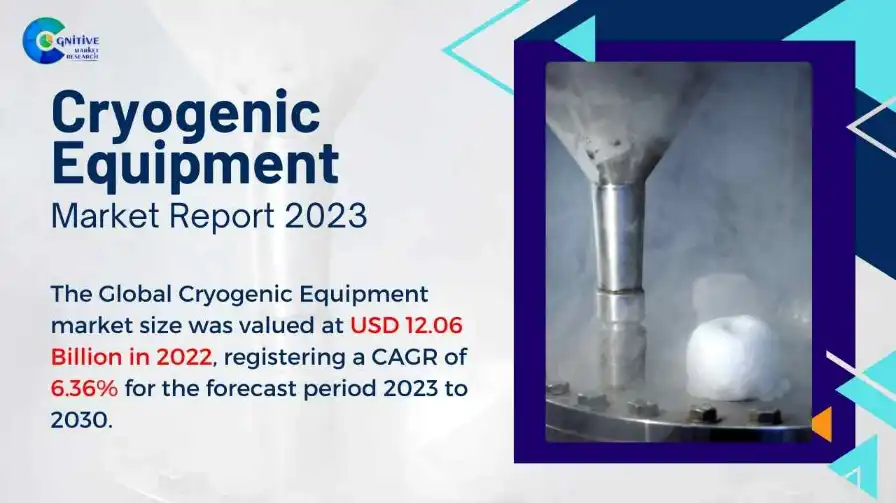
Global Cryogenic Equipment

At cognitive, a dedicated team has worked on this report, we have disclosed one of the team member involved in the publication and client consultation process for your reference. You can initiate the discussion her via Book an appointment
At cognitive, our research analyst works closely with Cryogenic Equipment market experts to validate the gathered data and have the expert's opinion available for our clients. You can book a consultation call with our research analyst and industry experts on board (Subject to time availability and paid consultation services)
The base year for the analysis is 2025. Historical data has been considered for the period from 2022 to 2025. The year 2026 is considered as the estimated base for forecasting, with projections covering the period from 2026 to 2034. When we deliver the report that time we updated report data till the purchase date.
From the database of Cognitive, this is an unique identification number of reports and it will also have different reports associated with it.
Report edition's total number of pages for pdf format (Approximate)
Rating and review received by the reader or subscriber of the said report.
Athenaeum Visualization Dashboard: Access your purchased data/Report/Service through a sophisticated, interactive interface. The Athenaeum Dashboard allows you to preview data/reports and store them in a customizable dashboard, enabling you to filter metrics and uncover deeper trends specific to your enterprise needs.
PDF Access: To ensure the highest level of data integrity and confidentiality, your premium report editions are delivered as password-protected PDF files. These are securely shared via email and remain accessible within your dedicated Athenaeum account for future reference.
Versatile Multi-Format Export (Excel & MS Word): We provide the flexibility to integrate our research directly into your internal workflows. Upon request, relevant quantitative data and qualitative insights from your purchased reports can be provided in fully editable Microsoft Excel and Word formats.
Multiple Cloud Accounts: Benefit from a dedicated, encrypted cloud account that ensures your market intelligence is available on-demand. Access your research from any device, at any time, and from any location. Multiple Accounts facilitating seamless collaboration across your collegue or whole organization.
Athenaeum AI Assistant(Value-Added Service): Elevate your research capabilities with Athenaeum AI Assistant, our proprietary 24/7 research assistant. Equivalent in depth to a dedicated research analyst, this AI-driven tool provides round-the-clock data support and instant insights to help you navigate complex market landscapes in real-time.
As Cognitive a market research and consulting firm, we can provide Cryogenic Equipment market Analysis and consultation services with the help of our data collection processes and Proprietary research methodology called Full Truth. We have in-house team of research analysts and network of industry experts on board. In fact, we provided high-impact consualtion services to the listed client in competitior analysis. As an extension of our bespoke consulting engagements, we also provide access to Proprietary datasets of market analysis publish, making authoritative industry intelligence accessible to the public domain.
Cryogenic Equipment Market Analysis 2026
Proprietary Database, Market Surveys, Strategic Consultation & Advisory Services, Industry & Competitive Intelligence. along with Report Access and Athenaeum Dashboard Subscription — Revenue, Volume, Production, Trade Analysis, value chain and supply chain analysis, Market Size, Share, Forecast, Drivers, Trends, Growth Opportunities, ESG and more.
| Data Timeline | Historical Data: 2022-2025 | Base Year: 2025 | Forecast Period: 2026-2034 |
|---|---|
| Type Segment Analysis | Tanks, Valves, Pumps & Vaporizers, Vacuum Jacketed Piping |
| Cryogen Segment Analysis | Nitrogen, Oxygen, Argon, Liquefied Natural Gas (LNG) |
| End Use Industry Segment Analysis | Oil & Gas, Metallurgy, Automotive, Food & Beverages, Chemicals, Others |
|---|---|
| Regions & Countries Analysis |
|
Share your contact details to receive free updated sample copy/pages of the recently published edition of Cryogenic Equipment Market Report 2025.
Global Cryogenic Equipment Market Analysis from 2022 to 2034 Containing Market Size, Share along with its CAGR, Forecast and Trends
Top 10 Countries Cryogenic Equipment Market Analysis includes Ranking, Market Size, Revenue in Million, Market Volume Million Units
Top 10 Countries Analysis of Cryogenic Equipment Market Share Distribution
The global Cryogenic Equipment market is experiencing robust growth, driven by the escalating demand for industrial gases, the rapid expansion of the healthcare and energy sectors, and the increasing adoption of cryogenic technologies across diverse applications. Valued at $19271.6 Million in 2021, it is projected to reach $25056.9 Million by 2025 and a substantial $42358.9 Million by 2033, demonstrating a Compound Annual Growth Rate (CAGR) of 6.783% from 2021 to 2033. Cryogenic equipment is essential for producing, storing, and transporting liquefied gases at extremely low temperatures. Key strategic insights reveal a strong trend towards energy-efficient solutions, advanced insulation technologies, and integration with renewable energy infrastructure, despite challenges from high manufacturing costs and stringent safety regulations.
Key strategic insights from our comprehensive analysis reveal:
The increasing global demand for industrial gases (e.g., oxygen, nitrogen, argon, LNG) across manufacturing, healthcare, and energy sectors is a primary driver for the Cryogenic Equipment market.
Technological advancements in cryogenic storage, transportation, and liquefaction technologies are enhancing efficiency, safety, and expanding application areas.
The growing emphasis on clean energy solutions and the development of LNG (Liquefied Natural Gas) infrastructure are creating significant opportunities for specialized cryogenic equipment.
Global Cryogenic Equipment Market Overview & Dynamics
The global Cryogenic Equipment market focuses on the design, manufacturing, and distribution of specialized machinery and systems used to produce, handle, store, and transport materials at extremely low temperatures (typically below −150 C or −238 F). This equipment is critical for the industrial gas industry, healthcare (e.g., cryopreservation, MRI), energy (e.g., LNG, hydrogen liquefaction), and various research and scientific applications. The market is characterized by its high-precision requirements, stringent safety standards, and continuous innovation in materials and thermal management.
Global Cryogenic Equipment Market Drivers
Increasing Demand for Industrial Gases: The growing consumption of industrial gases such as oxygen, nitrogen, argon, hydrogen, and helium across manufacturing, metallurgy, chemicals, and electronics industries drives the demand for cryogenic equipment for their liquefaction, storage, and distribution.
Expansion of the Healthcare and Life Sciences Sector: The rising need for cryopreservation of biological samples (e.g., cells, tissues, blood), increasing adoption of MRI technology, and advancements in cryosurgery and cryotherapy are significantly boosting the demand for cryogenic freezers, dewars, and related equipment.
Growth in Energy and Natural Gas Infrastructure: The global shift towards cleaner energy sources, particularly the expansion of LNG (Liquefied Natural Gas) production, storage, and transportation infrastructure, is a major driver for large-scale cryogenic tanks, heat exchangers, and pumps.
Global Cryogenic Equipment Market Trends
Development of Energy-Efficient and Sustainable Solutions: There is a strong trend towards designing cryogenic equipment that minimizes energy consumption during liquefaction and storage, utilizing advanced insulation technologies (e.g., vacuum insulation, multi-layer insulation) and optimizing heat exchange processes.
Focus on Miniaturization and Portability: Manufacturers are developing smaller, more compact, and portable cryogenic equipment, particularly for healthcare (e.g., portable liquid nitrogen dewars) and niche industrial applications, enhancing user convenience and flexibility.
Integration with Automation and Smart Technologies: Emerging trends include the integration of automation, sensors, and digital controls into cryogenic systems for remote monitoring, predictive maintenance, and optimized operational efficiency, particularly in large-scale industrial gas plants and LNG terminals.
Global Cryogenic Equipment Market Restraints
High Manufacturing Costs and Capital Expenditure: The production of cryogenic equipment involves specialized materials (e.g., stainless steel, aluminum alloys), precision engineering, and complex fabrication processes, leading to high manufacturing costs and significant capital investment.
Stringent Safety Regulations and Certification: The handling of extremely cold, often flammable or hazardous, liquefied gases necessitates strict safety standards and rigorous certification processes, adding to compliance costs and potentially delaying market entry for new products.
Vulnerability to Fluctuations in Energy Prices: The energy-intensive nature of gas liquefaction processes makes the operational costs of cryogenic equipment susceptible to volatility in electricity and natural gas prices, impacting overall profitability.
Strategic Recommendations for Manufacturers
To capitalize on market opportunities and mitigate restraints, manufacturers of Cryogenic Equipment should strategically focus on:
Innovate in Energy Efficiency and Sustainable Design: Invest heavily in R&D to develop next-generation cryogenic equipment that offers superior energy efficiency, utilizes advanced insulation materials, and incorporates sustainable manufacturing practices to reduce environmental impact.
Expand into Emerging LNG and Hydrogen Infrastructure: Target the rapidly growing LNG value chain (liquefaction, regasification, bunkering) and the nascent hydrogen economy (liquefaction, storage, transport) by offering specialized, high-capacity cryogenic solutions.
Enhance Automation and Digital Integration: Develop smart cryogenic equipment with integrated sensors, remote monitoring capabilities, and predictive analytics for optimized performance, reduced downtime, and enhanced safety in large-scale industrial and energy applications.
Strengthen Global Distribution and After-Sales Support: Expand distribution networks, particularly in high-growth emerging markets, and provide comprehensive technical support, maintenance services, and training to ensure the reliable and safe operation of cryogenic systems.
Detailed Cryogenic Equipment Market Regional Analysis: Data & Dynamics
The Cryogenic Equipment market exhibits diverse growth patterns and adoption rates across different geographical regions, influenced by industrial development, energy policies, and healthcare infrastructure.
The global market for Cryogenic Equipment is valued at $25056.9 Million in 2025.
North America Cryogenic Equipment Market analysis
Market Size: $4297.58 Million (2021) -> $5424.82 Million (2025) -> $8641.21 Million (2033)
CAGR (2021-2033): 5.992%
Country-Specific Insight: The United States holds approximately 17.59% of the global market in 2025, driven by a robust industrial gas industry, significant investments in healthcare and life sciences, and the expansion of LNG export terminals. Canada holds about 2.16% of the global market in 2025. Mexico holds about 1.89% of the global market in 2025.
Regional Dynamics:
Drivers: High demand for industrial gases in manufacturing, increasing investments in healthcare research, growth in LNG production and export.
Trends: Adoption of large-scale cryogenic storage tanks, focus on advanced insulation technologies, increasing use in aerospace and defense.
Restraints: Stringent safety regulations, high manufacturing costs, competition from alternative energy storage methods.
Technology Focus: Vacuum insulated cryogenic tanks, advanced liquefaction technologies, cryopreservation systems for biobanks.
Europe Cryogenic Equipment Market analysis
Market Size: $3642.34 Million (2021) -> $4610.47 Million (2025) -> $7497.52 Million (2033)
CAGR (2021-2033): 6.267%
Country-Specific Insight: Germany holds approximately 4.16% of the global market in 2025, benefiting from a strong industrial base, advanced healthcare infrastructure, and a focus on energy efficiency. The United Kingdom holds about 2.47% of the global market in 2025. France holds about 2.04% of the global market in 2025. Italy holds about 2.02% of the global market in 2025. Russia holds about 1.09% of the global market in 2025. Spain holds about 1.55% of the global market in 2025. Sweden holds about 1.30% of the global market in 2025. Denmark holds about 0.71% of the global market in 2025. Switzerland holds about 0.92% of the global market in 2025. Luxembourg holds about 0.21% of the global market in 2025.
Regional Dynamics:
Drivers: Established industrial gas market, increasing demand from healthcare sector, strong emphasis on sustainable energy solutions.
Trends: Development of cryogenic solutions for hydrogen storage, increasing adoption in food freezing and processing, focus on reducing carbon footprint.
Restraints: High energy costs for production, complex regulatory landscape across EU member states, competition from alternative cooling methods.
Technology Focus: Advanced heat exchangers, cryocoolers, solutions for medical cryotherapy.
Asia Pacific (APAC) Cryogenic Equipment Market analysis
Market Size: $8980.59 Million (2021) -> $11889.5 Million (2025) -> $20882.9 Million (2033)
CAGR (2021-2033): 7.295%
Country-Specific Insight: APAC is the largest and fastest-growing market. China holds approximately 13.95% of the global market in 2025, driven by its massive industrial output, rapid expansion of healthcare facilities, and significant investments in LNG infrastructure. Japan holds about 7.43% of the global market in 2025. India holds about 8.18% of the global market in 2025. South Korea holds about 4.60% of the global market in 2025. Australia holds about 1.77% of the global market in 2025. Singapore holds about 1.55% of the global market in 2025. South East Asia holds about 3.51% of the global market in 2025. Taiwan holds about 1.48% of the global market in 2025.
Regional Dynamics:
Drivers: Rapid industrialization and urbanization, increasing demand for medical oxygen and other industrial gases, significant investments in LNG import/export terminals.
Trends: Expansion of domestic manufacturing capabilities, increasing adoption of cryogenic equipment in food processing and pharmaceuticals, focus on cost-effective solutions.
Restraints: Price sensitivity, varying quality standards, challenges in technology transfer.
Technology Focus: Large-scale air separation units (ASUs), LNG storage tanks, cryogenic pumps for industrial applications.
South America Cryogenic Equipment Market analysis
Market Size: $1079.21 Million (2021) -> $1423.23 Million (2025) -> $2466.13 Million (2033)
CAGR (2021-2033): 7.113%
Country-Specific Insight: Brazil holds approximately 2.08% of the global market in 2025, driven by its large industrial sector, growing healthcare investments, and increasing demand for industrial gases. Argentina holds about 1.13% of the global market in 2025. Colombia holds about 1.01% of the global market in 2025. Peru holds about 0.44% of the global market in 2025. Chile holds about 0.47% of the global market in 2025.
Regional Dynamics:
Drivers: Expanding industrial base, increasing investments in healthcare infrastructure, growing demand for liquefied industrial gases.
Trends: Adoption of standard cryogenic storage and transport solutions, increasing local production of industrial gases, focus on improving operational efficiency.
Restraints: Economic volatility, limited access to advanced cryogenic technologies, reliance on imports for specialized equipment.
Technology Focus: Cryogenic liquid cylinders, small-scale liquefiers, basic cryopreservation systems.
Africa Cryogenic Equipment Market analysis
Market Size: $539.606 Million (2021) -> $745.443 Million (2025) -> $1211.89 Million (2033)
CAGR (2021-2033): 6.263%
Country-Specific Insight: South Africa holds approximately 1.08% of the global market in 2025, with a relatively developed industrial and healthcare sector. Nigeria holds about 0.43% of the global market in 2025.
Regional Dynamics:
Drivers: Emerging industrial sectors, increasing investments in healthcare infrastructure, growing demand for medical oxygen and industrial gases.
Trends: Development of local industrial gas production facilities, adoption of basic cryogenic equipment for medical use, increasing partnerships with international suppliers.
Restraints: Limited funding for advanced equipment, challenges in infrastructure development, reliance on imports for high-tech solutions.
Technology Focus: Medical oxygen concentrators, small-scale liquid nitrogen generators, basic cold chain solutions.
Middle East Cryogenic Equipment Market analysis
Market Size: $732.323 Million (2021) -> $963.438 Million (2025) -> $1659.2 Million (2033)
CAGR (2021-2033): 7.031%
Country-Specific Insight: Saudi Arabia holds approximately 1.03% of the global market in 2025, driven by massive investments in petrochemical complexes, a growing healthcare sector, and ambitious plans for hydrogen production. Turkey holds about 0.76% of the global market in 2025. UAE holds about 0.65% of the global market in 2025. Egypt holds about 0.56% of the global market in 2025. Qatar holds about 0.35% of the global market in 2025.
Regional Dynamics:
Drivers: Significant investments in petrochemical and energy sectors, rapid expansion of healthcare facilities, growing demand for industrial gases.
Trends: Development of large-scale LNG and hydrogen liquefaction projects, increasing adoption in medical tourism, focus on energy diversification.
Restraints: Reliance on imported technology and expertise, geopolitical factors impacting investment, high cost of advanced cryogenic solutions.
Technology Focus: Large-scale cryogenic storage, advanced heat exchangers for LNG, solutions for hydrogen liquefaction and transport.
Competitive Landscape of Cryogenic Equipment market
The Cryogenic Equipment market is a dynamic battleground between three primary categories of vendors: large multinational industrial gas companies that are vertically integrated across gas production and equipment manufacturing; specialized cryogenic equipment manufacturers focusing on specific product types (e.g., tanks, pumps, valves) or niche applications; and engineering, procurement, and construction (EPC) firms that integrate cryogenic solutions into large-scale industrial projects. Key global players often include Linde plc, Air Liquide S.A., Air Products and Chemicals, Inc., Chart Industries, Inc., Cryofab, Inc., Taylor-Wharton (part of Worthington Industries), Fives Group, Cryostar SAS, and Sumitomo Heavy Industries, Ltd. These companies compete on factors such as technological innovation (e.g., efficiency, safety), product reliability, customization capabilities, global manufacturing footprint, and comprehensive after-sales service. The market is also characterized by strategic alliances and acquisitions to expand product portfolios and geographical reach.
Key Takeaways
The global Cryogenic Equipment market is experiencing robust growth, primarily fueled by the escalating demand for industrial gases and the expansion of the healthcare and energy sectors.
Key trends include the development of energy-efficient and sustainable solutions, miniaturization and portability for diverse applications, and integration with automation and smart technologies.
Asia Pacific is the largest and fastest-growing region, driven by its massive industrial output and investments in energy infrastructure, while North America and Europe maintain significant market shares.
Manufacturers must strategically invest in R&D for advanced liquefaction and storage technologies, target emerging clean energy applications (LNG, hydrogen), and provide comprehensive global support to capitalize on future growth opportunities.
Market Drivers:
|
Market Restrains:
|
Market Trends:
|
| Market Size | 2021 (A) | 2025 (A) | 2033 (P) | CAGR |
|---|---|---|---|---|
| Global Cryogenic Equipment Market Sales Revenue | $ 19271.6 Million | $ 25056.9 Million | $ 42358.9 Million | 6.783% |
| North America Cryogenic Equipment Market Sales Revenue | $ 4297.58 Million | $ 5424.82 Million | $ 8641.21 Million | 5.992% |
| United States Cryogenic Equipment Market Sales Revenue | $ 3506.82 Million | $ 4408.21 Million | $ 6958.77 Million | 5.873% |
| Canada Cryogenic Equipment Market Sales Revenue | $ 416.865 Million | $ 541.939 Million | $ 916.832 Million | 6.793% |
| Mexico Cryogenic Equipment Market Sales Revenue | $ 373.889 Million | $ 474.672 Million | $ 765.611 Million | 6.158% |
| Europe Cryogenic Equipment Market Sales Revenue | $ 3642.34 Million | $ 4610.47 Million | $ 7497.52 Million | 6.267% |
| United Kingdom Cryogenic Equipment Market Sales Revenue | $ 480.789 Million | $ 617.803 Million | $ 1032.41 Million | 6.629% |
| Germany Cryogenic Equipment Market Sales Revenue | $ 808.6 Million | $ 1041.97 Million | $ 1776.91 Million | 6.9% |
| France Cryogenic Equipment Market Sales Revenue | $ 413.77 Million | $ 512.223 Million | $ 791.738 Million | 5.594% |
| Italy Cryogenic Equipment Market Sales Revenue | $ 404.3 Million | $ 506.23 Million | $ 803.734 Million | 5.949% |
| Russia Cryogenic Equipment Market Sales Revenue | $ 227.282 Million | $ 273.862 Million | $ 404.116 Million | 4.984% |
| Spain Cryogenic Equipment Market Sales Revenue | $ 303.043 Million | $ 387.74 Million | $ 644.787 Million | 6.564% |
| Sweden Cryogenic Equipment Market Sales Revenue | $ 255.692 Million | $ 325.96 Million | $ 536.447 Million | 6.425% |
| Denmark Cryogenic Equipment Market Sales Revenue | $ 142.051 Million | $ 177.503 Million | $ 281.907 Million | 5.953% |
| Switzerland Cryogenic Equipment Market Sales Revenue | $ 186.852 Million | $ 231.446 Million | $ 359.131 Million | 5.645% |
| Luxembourg Cryogenic Equipment Market Sales Revenue | $ 43.708 Million | $ 53.251 Million | $ 79.774 Million | 5.182% |
| Rest of Europe Cryogenic Equipment Market Sales Revenue | $ 376.254 Million | $ 482.486 Million | $ 786.565 Million | 6.3% |
| Asia Pacific Cryogenic Equipment Market Sales Revenue | $ 8980.59 Million | $ 11889.5 Million | $ 20882.9 Million | 7.295% |
| China Cryogenic Equipment Market Sales Revenue | $ 2622.33 Million | $ 3495.51 Million | $ 6233.55 Million | 7.499% |
| Japan Cryogenic Equipment Market Sales Revenue | $ 1436.89 Million | $ 1860.71 Million | $ 3103.2 Million | 6.602% |
| India Cryogenic Equipment Market Sales Revenue | $ 1508.74 Million | $ 2050.94 Million | $ 3800.69 Million | 8.016% |
| South Korea Cryogenic Equipment Market Sales Revenue | $ 889.078 Million | $ 1152.09 Million | $ 1940.02 Million | 6.731% |
| Australia Cryogenic Equipment Market Sales Revenue | $ 359.224 Million | $ 444.667 Million | $ 687.048 Million | 5.589% |
| Singapore Cryogenic Equipment Market Sales Revenue | $ 287.379 Million | $ 387.598 Million | $ 699.578 Million | 7.661% |
| South East Asia Cryogenic Equipment Market Sales Revenue | $ 646.602 Million | $ 878.634 Million | $ 1614.25 Million | 7.9% |
| Taiwan Cryogenic Equipment Market Sales Revenue | $ 289.355 Million | $ 369.763 Million | $ 621.476 Million | 6.706% |
| South America Cryogenic Equipment Market Sales Revenue | $ 1079.21 Million | $ 1423.23 Million | $ 2466.13 Million | 7.113% |
| Brazil Cryogenic Equipment Market Sales Revenue | $ 397.15 Million | $ 520.903 Million | $ 893.233 Million | 6.973% |
| Argentina Cryogenic Equipment Market Sales Revenue | $ 210.446 Million | $ 282.227 Million | $ 507.284 Million | 7.605% |
| Colombia Cryogenic Equipment Market Sales Revenue | $ 192.1 Million | $ 252.965 Million | $ 424.274 Million | 6.678% |
| Peru Cryogenic Equipment Market Sales Revenue | $ 84.179 Million | $ 110.272 Million | $ 188.117 Million | 6.904% |
| Chile Cryogenic Equipment Market Sales Revenue | $ 88.495 Million | $ 117.701 Million | $ 207.895 Million | 7.37% |
| Rest of South America Cryogenic Equipment Market Sales Revenue | $ 106.842 Million | $ 139.164 Million | $ 245.331 Million | 7.344% |
| Middle East Cryogenic Equipment Market Sales Revenue | $ 732.323 Million | $ 963.438 Million | $ 1659.2 Million | 7.031% |
| Saudi Arabia Cryogenic Equipment Market Sales Revenue | $ 194.798 Million | $ 257.142 Million | $ 445.66 Million | 7.116% |
| Turkey Cryogenic Equipment Market Sales Revenue | $ 144.268 Million | $ 191.628 Million | $ 337.978 Million | 7.35% |
| UAE Cryogenic Equipment Market Sales Revenue | $ 120.101 Million | $ 161.761 Million | $ 292.682 Million | 7.694% |
| Egypt Cryogenic Equipment Market Sales Revenue | $ 108.384 Million | $ 140.758 Million | $ 234.279 Million | 6.575% |
| Qatar Cryogenic Equipment Market Sales Revenue | $ 66.641 Million | $ 86.623 Million | $ 146.192 Million | 6.761% |
| Rest of Middle East Cryogenic Equipment Market Sales Revenue | $ 98.131 Million | $ 125.526 Million | $ 202.405 Million | 6.154% |
| Africa Cryogenic Equipment Market Sales Revenue | $ 539.606 Million | $ 745.443 Million | $ 1211.89 Million | 6.263% |
| Nigeria Cryogenic Equipment Market Sales Revenue | $ 76.624 Million | $ 107.195 Million | $ 177.784 Million | 6.528% |
| South Africa Cryogenic Equipment Market Sales Revenue | $ 192.1 Million | $ 271.043 Million | $ 463.183 Million | 6.927% |
Cryogenic Equipment Market is Segmented as below. Particular segment of your interest can be provided without any additional cost. Download the Sample Pages!
Cryogenic Equipment Market Report Description
What is Cryogenic Equipment Market?
Cryogenic equipment refers to the devices, machines, and systems that store, handle, and transport materials at extremely low temperatures. Cryogenic equipment is used to generate, transport, and store cryogens at cryogenic temperatures for a variety of markets. From simple flexible hose orders to complex piping systems.
Cryogenic Equipment Market Size
What is Driving the Cryogenic Equipment Market?
Increasing demand for cryogenic products in various fields, from space exploration to the advancement of new medical treatments along with the rise in popularity of LNG as an environmentally sustainable fuel is the main driving factor contributing to the growth of the global cryogenic equipment market during the forecast period. These are increasingly adopted for the long-term storage of biological samples, including cells, tissues, and DNA, at ultra-low temperatures. In addition, the rise in the adoption of sustainable machining methods that satisfies the industry standard is another factor that propels the demand for the cryogenic equipment market.
However, extensive energy requirements for regeneration and the high operating cost of systems may obstruct the growth of the global cryogenic equipment market in near future. Further, greater awareness of cryogenic engineering and cryogenic equipment is expected to create lucrative opportunities for the cryogenic equipment market during the forecast period.
We have various report editions of Cryogenic Equipment Market, hence please contact our sales team and author directly to obtain/purchase a desired Edition eg, Global Edition, Regional Edition, Country Specific Report Edition, Company Profiles, Forecast Edition, etc. Request for your Free Sample PDF/Online Access.
Cryogenic Equipment Market Insights Video
Top Companies in Cryogenic Equipment Market
Our report features detailed profiles of key competitors in the Cryogenic Equipment market, covering financials and forecasts (2021–2033), revenue, margins, market share, and strategic initiatives such as M&A, partnerships, and product pipelines. Each profile includes a SWOT analysis, along with insights into supply chain resilience and sustainability (ESG) efforts. Full competitive intelligence and customized data options are available in the paid report.
Top Companies Market Share in Cryogenic Equipment Industry: (In no particular order of Rank)
| Companies | 2022 (A) | 2023 (A) | 2024 (A) | 2025 (A) |
|---|---|---|---|---|
| Air Liquide | xxxx | xxxx | xxxx | xxxx |
| Linde Group AG | xxxx | xxxx | xxxx | xxxx |
| Chart Industries | xxxx | xxxx | xxxx | xxxx |
| Cryofab | xxxx | xxxx | xxxx | xxxx |
| Cryoquip | xxxx | xxxx | xxxx | xxxx |
| Herose Gmbh | xxxx | xxxx | xxxx | xxxx |
| Inox India | xxxx | xxxx | xxxx | xxxx |
| Taylor Wharton International | xxxx | xxxx | xxxx | xxxx |
| VRV S.P.A. | xxxx | xxxx | xxxx | xxxx |
| Wessington Cryogenics | xxxx | xxxx | xxxx | xxxx |
| Beijing Tianhai Industry | xxxx | xxxx | xxxx | xxxx |
*List of Second Tier Companies, List of Third Tier/ Start-up Companies (Inquire with sales executive)
Request Any Company Profile for Preview Purpose OR Data Validation!
If any Company(ies) of your interest has/have not been disclosed in the above list then please let us know the same so that we will check the data availability in our database and provide you the confirmation or include it in the final deliverables.
Regional Analysis of the Cryogenic Equipment Market
Asia Pacific is expected to dominate the cryogenic equipment market during the forecast period. The growth of market is significantly growing in the region due to rapid industrialization and the growing demand for medical gases and products. The Asia Pacific region is witnessing significant growth in the electronics and semiconductor industries, which use cryogenic equipment for cooling and processing electronic components. The increasing demand for energy in the region has led to the building of new LNG plants and infrastructure, further boosting the demand for cryogenic equipment.
The current report Scope analyzes Cryogenic Equipment Market on 6 major region Split (In case you wish to acquire a specific region edition (more granular data) or any country Edition data then please write us on info@cognitivemarketresearch.com
- North America (United States, Canada, Mexico)
- Europe (United Kingdom, France, Germany, Italy, Russia, Spain, Sweden, Denmark, Switzerland, Luxembourg, Rest of Europe)
- Asia Pacific (China, Japan, South Korea, India, Australia, Singapore, Taiwan, South East Asia, Rest of APAC)
- South America (Brazil, Argentina, Colombia, Peru, Chile, Rest of South America)
- Middle East (Saudi Arabia, Turkey, UAE, Egypt, Qatar, Rest of Middle East)
- Africa (East Africa, West Africa, North Africa, South Africa)
Cryogenic Equipment Market Share (%) by Region (2022-2034)
The above graph is for illustrative purposes only.
To learn more about geographical trends request the free sample pages.
Get Free Sample
Author's Conclusion
Our study will explain complete manufacturing process along with major raw materials required to manufacture end-product. This report helps to make effective decisions determining product position and will assist you to understand opportunities and threats around the globe.
The Global Cryogenic Equipment Market is witnessing significant growth in the near future.
In 2023, the Tanks segment accounted for noticeable share of global Cryogenic Equipment Market and is projected to experience significant growth in the near future.
The Nitrogen segment is expected to expand at the significant CAGR retaining position throughout the forecast period.
Some of the key companies Air Liquide, Chart Industries and others are focusing on its strategy building model to strengthen its product portfolio and expand its business in the global market.
Author's Detail
Pratik ShirsathSenior Research Associate at Cognitive Market Research
LinkedIn | Profile | Book Appointment
Pratik Shirsath is a dedicated Senior Research Associate specializing in the Machinery and Equipment industry. With strong expertise in secondary research, competitive benchmarking, and market evaluation, he delivers data-driven insights that support strategic decision-making. Pratik excels at identifying technological shifts, analyzing equipment demand trends, and translating complex market information into clear, actionable findings. His commitment to precision and industry understanding makes him a valuable contributor in navigating the evolving machinery and equipment landscape.
Pratik Shirsath is an accomplished Research Analyst with extensive expertise in the agriculture sector, bringing over one years of experience in market research and analysis. Pratik specializes in secondary research, competitive benchmarking, and data-driven insights that empower organizations to make strategic decisions and achieve their goals.
In his current role, Pratik leads research projects focused on the agriculture sector, driving initiatives that identify emerging market trends, assess competitive landscapes, and uncover growth opportunities. His proficiency in designing effective research methodologies and translating complex data into actionable strategies has consistently supported his organization’s objectives.
Pratik's dedication to delivering high-quality research and his in-depth knowledge of the agriculture industry have made him a trusted resource for his team and stakeholders. Passionate about innovation and sustainability in agriculture, he remains committed to advancing his expertise to navigate the evolving challenges and opportunities in the sector.
Frequently Asked Questions
Reviews
Cognitive Market Research masters the intricacies of market dynamics. Their research delves into the underlying forces that drive market changes, giving us a profound understanding of the factors influencing our industry
Cryogenic Equipment Market Segmentation Analysis from 2022 till 2034
Global Cryogenic Equipment Market Report 2025 Edition talks about crucial market insights with the help of segments and sub-segments analysis. In this section, we reveal an in-depth analysis of the key factors influencing Cryogenic Equipment Industry growth. Cryogenic Equipment market has been segmented with the help of its Type, Cryogen End Use Industry , and others. Cryogenic Equipment market analysis helps to understand key industry segments, and their global, regional, and country-level insights. Furthermore, this analysis also provides information pertaining to segments that are going to be most lucrative in the near future and their expected growth rate and future market opportunities. The report also provides detailed insights into factors responsible for the positive or negative growth of each industry segment.
By Type, the Tanks segment acquired the major revenue share of Cryogenic Equipment Market!
The tanks segment acquired the major revenue share during the forecast period. This is because these cryogenic tanks are significantly adapted to store liquefied gases such as nitrogen, oxygen, and argon at cryogenic temperatures.
- Tanks
- Valves
- Pumps & Vaporizers
- Vacuum Jacketed Piping
Cryogenic Equipment Market Share (%) by Type in 2022-2034
The above Chart is for representative purposes and does not depict actual sale statistics. Access/Request the quantitative data to understand the trends and dominating segment of Cryogenic Equipment Industry. Request a Free Sample PDF!
By Application, the Liquefied Natural Gas (LNG) segment held a significant market share of Cryogenic Equipment Market!
Liquefied Natural Gas (LNG) held a significant market share, as rising awareness toward environment-friendly sources of energy. It presents a number of characteristics that must be taken into account when looking for storage alternatives. For example, For example, U.S. LNG exports continued to grow in 2021, averaging 42% or 2.8 Bcf/d.
- Nitrogen
- Oxygen
- Argon
- Liquefied Natural Gas (LNG)
Cryogenic Equipment Market Share (%) by Cryogen in 2022-2034
2022
2026
2034
The above Graph is for representation purposes only. This chart does not depict actual Market share.
To learn more about market share request the free sample pages.
Get Free Sample
End Use Industry Segmentation Analysis from 2022 till 2034: Oil & Gas, Metallurgy, Automotive, Food & Beverages, Chemicals, Others
Based on the end-use industry, the metallurgy segment is expected to hold a significant share during the forecast period. This is due to cryogenic equipment playing an important role in the metallurgy industry, particularly in the production and processing of metals that require extremely low temperatures.
- Oil & Gas
- Metallurgy
- Automotive
- Food & Beverages
- Chemicals
- Others
Cryogenic Equipment Market Report Table of Content
Disclaimer:
- This is just a redacted sample pages of the actual deliverable report and only for representative purposes
- Charts/Graphs/Numbers/data are only for Representative purposes and do not depict actual statistics.
- The table of Contents differs according to the user License selection. Current Displayed TOC is for the Corporate User License Report Edition. TOC Customization options: Add or Remove section/s Or chapter/s from the report.
- Specific Tables, Graphs, Sections, and Chapters can be ordered at a discounted price.
- If applicable; On Request Volume Data will also be provided (at an Additional Cost).
| Type | Tanks, Valves, Pumps & Vaporizers, Vacuum Jacketed Piping |
| Cryogen | Nitrogen, Oxygen, Argon, Liquefied Natural Gas (LNG) |
| End Use Industry | Oil & Gas, Metallurgy, Automotive, Food & Beverages, Chemicals, Others |
| List of Competitors | Air Liquide, Linde Group AG, Chart Industries, Cryofab, Cryoquip, Herose Gmbh, Inox India, Taylor Wharton International, VRV S.P.A., Wessington Cryogenics, Beijing Tianhai Industry |
Chapter 1 2026 Geopolitical Outlook - Cryogenic Equipment Market Detailed Analysis
-
1.1 Global Power Realignment & Strategic Alliances
-
1.2 Geopolitical Risk Landscape & Conflict Hotspots
-
1.3 International Trade Relations & Market Access Environment
-
1.4 Regulatory & Policy Shifts Impacting Cross-Border Operations
-
1.5 Supply Chain Resilience, Localization & Resource Nationalism
-
1.6 Technology Sovereignty & Digital Geopolitics
-
1.7 Strategic Implications for Investment, Growth & Market Entry
This chapter isn't just about technology; it’s about certainty. We show you how AI is being used in leading industries so you can apply those same 'High-Speed' and 'High-Accuracy' principles to your own market strategy
Chapter 2 AI's Impact on Market - Detailed Qualitative Analysis
-
2.1 Competitive Landscape Disruption & Strategic Shifts
-
2.2 AI-Driven Transformation of Industry Value Chain
-
2.3 Evolution of Business Models & Revenue Streams
-
2.4 Operational Efficiency & Cost Structure Transformation
-
2.5 Product, Service & Innovation Acceleration
-
2.6 Customer Behavior & Demand Evolution
-
2.7 Future Outlook: AI-Led Market Evolution & Strategic Implications
This chapter will help you gain GLOBAL Market Analysis of Cryogenic Equipment. Further deep in this chapter, you will be able to review Global Cryogenic Equipment Market Split by various segments and Geographical Split.
Chapter 3 Global Market Analysis
-
3.1 Global Cryogenic Equipment Revenue Market Size, Trend Analysis 2022 - 2034
-
3.2 Global Cryogenic Equipment Volume Market Sales, Trend Analysis 2022 - 2034
-
3.3 Global Cryogenic Equipment Market Size By Regions 2022 - 2034
Global Market has been segmented on the basis 5 major regions such as North America, Europe, Asia-Pacific, Middle East & Africa, and Latin America.
-
3.3.1 Global Cryogenic Equipment Revenue Market Size By Region
-
3.3.2 Global Cryogenic Equipment Volume Market Sales By Region
-
-
3.4 Global Cryogenic Equipment Market Size By Type 2022 - 2034
-
3.4.1 Tanks Market Size
-
3.4.2 Valves Market Size
-
3.4.3 Pumps & Vaporizers Market Size
-
3.4.4 Vacuum Jacketed Piping Market Size
-
-
3.5 Global Cryogenic Equipment Volume Market Sales By Type 2022 - 2034
-
3.5.1 Tanks Sales Volume
-
3.5.2 Valves Sales Volume
-
3.5.3 Pumps & Vaporizers Sales Volume
-
3.5.4 Vacuum Jacketed Piping Sales Volume
-
-
3.6 Global Cryogenic Equipment Market Size By Cryogen 2022 - 2034
-
3.6.1 Nitrogen Market Size
-
3.6.2 Oxygen Market Size
-
3.6.3 Argon Market Size
-
3.6.4 Liquefied Natural Gas (LNG) Market Size
-
-
3.7 Global Cryogenic Equipment Volume Market Sales By Cryogen 2022 - 2034
-
3.7.1 Nitrogen Sales Volume
-
3.7.2 Oxygen Sales Volume
-
3.7.3 Argon Sales Volume
-
3.7.4 Liquefied Natural Gas (LNG) Sales Volume
-
-
3.8 Global Cryogenic Equipment Market Size By End Use Industry 2022 - 2034
-
3.8.1 Oil & Gas Market Size
-
3.8.2 Metallurgy Market Size
-
3.8.3 Automotive Market Size
-
3.8.4 Food & Beverages Market Size
-
3.8.5 Chemicals Market Size
-
3.8.6 Others Market Size
-
-
3.9 Global Cryogenic Equipment Volume Market Sales By End Use Industry 2022 - 2034
-
3.9.1 Oil & Gas Sales Volume
-
3.9.2 Metallurgy Sales Volume
-
3.9.3 Automotive Sales Volume
-
3.9.4 Food & Beverages Sales Volume
-
3.9.5 Chemicals Sales Volume
-
3.9.6 Others Sales Volume
-
-
3.10 Global Level Competitor Analysis (Subject to Data Availability (Private Players))
-
3.11 Executive Summary Global Market (2021 vs 2025 vs 2033)
You can purchase only the Executive Summary of Global Market (2019 vs 2024 vs 2031)
-
3.11.1 Regional Market Revenue Summary 2021 vs 2025 vs 2033
-
3.11.2 Regional Volume Market Summary 2021 vs 2025 vs 2033
-
3.11.3 Global Market Revenue Split By Type
-
3.11.4 Global Volume Market Split By Type
-
3.11.5 Global Market Revenue Split By Cryogen
-
3.11.6 Global Volume Market Split By Cryogen
-
3.11.7 Global Market Revenue Split By End Use Industry
-
3.11.8 Global Volume Market Split By End Use Industry
-
3.11.9 Global Market Dynamics, Trends, Drivers, Restraints, Opportunities
Global Market Dynamics, Trends, Drivers, Restraints, Opportunities, Only Pointers will be deliverable
-
This chapter will help you gain North America Market Analysis of Cryogenic Equipment. Further deep in this chapter, you will be able to review North America Cryogenic Equipment Market Split by various segments and Country Split.
Chapter 4 North America Market Analysis
-
4.1 North America Cryogenic Equipment Market Outlook
-
4.1.1 North America Cryogenic Equipment Market Size 2022 - 2034
-
4.1.2 North America Cryogenic Equipment Volume Market Sales 2022 - 2034
-
4.1.3 North America Cryogenic Equipment Market Size By Country 2022 - 2034
-
4.1.4 North America Cryogenic Equipment Volume Market Sales By Country 2022 - 2034
-
4.1.5 North America Cryogenic Equipment Market Size by Type 2022 - 2034
-
4.1.5.1 North America Tanks Market Size
-
4.1.5.2 North America Valves Market Size
-
4.1.5.3 North America Pumps & Vaporizers Market Size
-
4.1.5.4 North America Vacuum Jacketed Piping Market Size
-
-
4.1.6 North America Cryogenic Equipment Volume Market Sales by Type 2022 - 2034
-
4.1.6.1 North America Tanks Sales Volume
-
4.1.6.2 North America Valves Sales Volume
-
4.1.6.3 North America Pumps & Vaporizers Sales Volume
-
4.1.6.4 North America Vacuum Jacketed Piping Sales Volume
-
-
4.1.7 North America Cryogenic Equipment Market Size by Cryogen 2022 - 2034
-
4.1.7.1 North America Nitrogen Market Size
-
4.1.7.2 North America Oxygen Market Size
-
4.1.7.3 North America Argon Market Size
-
4.1.7.4 North America Liquefied Natural Gas (LNG) Market Size
-
-
4.1.8 North America Cryogenic Equipment Volume Market Sales by Cryogen 2022 - 2034
-
4.1.8.1 North America Nitrogen Sales Volume
-
4.1.8.2 North America Oxygen Sales Volume
-
4.1.8.3 North America Argon Sales Volume
-
4.1.8.4 North America Liquefied Natural Gas (LNG) Sales Volume
-
-
4.1.9 North America Cryogenic Equipment Market Size by End Use Industry 2022 - 2034
-
4.1.9.1 North America Oil & Gas Market Size
-
4.1.9.2 North America Metallurgy Market Size
-
4.1.9.3 North America Automotive Market Size
-
4.1.9.4 North America Food & Beverages Market Size
-
4.1.9.5 North America Chemicals Market Size
-
4.1.9.6 North America Others Market Size
-
-
4.1.10 North America Cryogenic Equipment Volume Market Sales by End Use Industry 2022 - 2034
-
4.1.10.1 North America Oil & Gas Sales Volume
-
4.1.10.2 North America Metallurgy Sales Volume
-
4.1.10.3 North America Automotive Sales Volume
-
4.1.10.4 North America Food & Beverages Sales Volume
-
4.1.10.5 North America Chemicals Sales Volume
-
4.1.10.6 North America Others Sales Volume
-
-
This chapter will help you gain Europe Market Analysis of Cryogenic Equipment. Further deep in this chapter, you will be able to review Europe Cryogenic Equipment Market Split by various segments and Country Split.
Chapter 5 Europe Market Analysis
-
5.1 Europe Cryogenic Equipment Market Outlook
-
5.1.1 Europe Cryogenic Equipment Market Size 2022 - 2034
-
5.1.2 Europe Cryogenic Equipment Volume Market Sales 2022 - 2034
-
5.1.3 Europe Cryogenic Equipment Market Size By Country 2022 - 2034
-
5.1.4 Europe Cryogenic Equipment Volume Market Sales By Country 2022 - 2034
-
5.1.5 Europe Cryogenic Equipment Market Size by Type 2022 - 2034
-
5.1.5.1 Europe Tanks Market Size
-
5.1.5.2 Europe Valves Market Size
-
5.1.5.3 Europe Pumps & Vaporizers Market Size
-
5.1.5.4 Europe Vacuum Jacketed Piping Market Size
-
-
5.1.6 Europe Cryogenic Equipment Volume Market Sales by Type 2022 - 2034
-
5.1.6.1 Europe Tanks Sales Volume
-
5.1.6.2 Europe Valves Sales Volume
-
5.1.6.3 Europe Pumps & Vaporizers Sales Volume
-
5.1.6.4 Europe Vacuum Jacketed Piping Sales Volume
-
-
5.1.7 Europe Cryogenic Equipment Market Size by Cryogen 2022 - 2034
-
5.1.7.1 Europe Nitrogen Market Size
-
5.1.7.2 Europe Oxygen Market Size
-
5.1.7.3 Europe Argon Market Size
-
5.1.7.4 Europe Liquefied Natural Gas (LNG) Market Size
-
-
5.1.8 Europe Cryogenic Equipment Volume Market Sales by Cryogen 2022 - 2034
-
5.1.8.1 Europe Nitrogen Sales Volume
-
5.1.8.2 Europe Oxygen Sales Volume
-
5.1.8.3 Europe Argon Sales Volume
-
5.1.8.4 Europe Liquefied Natural Gas (LNG) Sales Volume
-
-
5.1.9 Europe Cryogenic Equipment Market Size by End Use Industry 2022 - 2034
-
5.1.9.1 Europe Oil & Gas Market Size
-
5.1.9.2 Europe Metallurgy Market Size
-
5.1.9.3 Europe Automotive Market Size
-
5.1.9.4 Europe Food & Beverages Market Size
-
5.1.9.5 Europe Chemicals Market Size
-
5.1.9.6 Europe Others Market Size
-
-
5.1.10 Europe Cryogenic Equipment Volume Market Sales by End Use Industry 2022 - 2034
-
5.1.10.1 Europe Oil & Gas Sales Volume
-
5.1.10.2 Europe Metallurgy Sales Volume
-
5.1.10.3 Europe Automotive Sales Volume
-
5.1.10.4 Europe Food & Beverages Sales Volume
-
5.1.10.5 Europe Chemicals Sales Volume
-
5.1.10.6 Europe Others Sales Volume
-
-
This chapter will help you gain Asia Pacific Market Analysis of Cryogenic Equipment. Further deep in this chapter, you will be able to review Asia Pacific Cryogenic Equipment Market Split by various segments and Country Split.
Chapter 6 Asia Pacific Market Analysis
-
6.1 Asia Pacific Cryogenic Equipment Market Outlook
-
6.1.1 Asia Pacific Cryogenic Equipment Market Size 2022 - 2034
-
6.1.2 Asia Pacific Cryogenic Equipment Volume Market Sales 2022 - 2034
-
6.1.3 Asia Pacific Cryogenic Equipment Market Size By Country 2022 - 2034
-
6.1.4 Asia Pacific Cryogenic Equipment Volume Market Sales By Country 2022 - 2034
-
6.1.5 Asia Pacific Cryogenic Equipment Market Size by Type 2022 - 2034
-
6.1.5.1 Asia Pacific Tanks Market Size
-
6.1.5.2 Asia Pacific Valves Market Size
-
6.1.5.3 Asia Pacific Pumps & Vaporizers Market Size
-
6.1.5.4 Asia Pacific Vacuum Jacketed Piping Market Size
-
-
6.1.6 Asia Pacific Cryogenic Equipment Volume Market Sales by Type 2022 - 2034
-
6.1.6.1 Asia Pacific Tanks Sales Volume
-
6.1.6.2 Asia Pacific Valves Sales Volume
-
6.1.6.3 Asia Pacific Pumps & Vaporizers Sales Volume
-
6.1.6.4 Asia Pacific Vacuum Jacketed Piping Sales Volume
-
-
6.1.7 Asia Pacific Cryogenic Equipment Market Size by Cryogen 2022 - 2034
-
6.1.7.1 Asia Pacific Nitrogen Market Size
-
6.1.7.2 Asia Pacific Oxygen Market Size
-
6.1.7.3 Asia Pacific Argon Market Size
-
6.1.7.4 Asia Pacific Liquefied Natural Gas (LNG) Market Size
-
-
6.1.8 Asia Pacific Cryogenic Equipment Volume Market Sales by Cryogen 2022 - 2034
-
6.1.8.1 Asia Pacific Nitrogen Sales Volume
-
6.1.8.2 Asia Pacific Oxygen Sales Volume
-
6.1.8.3 Asia Pacific Argon Sales Volume
-
6.1.8.4 Asia Pacific Liquefied Natural Gas (LNG) Sales Volume
-
-
6.1.9 Asia Pacific Cryogenic Equipment Market Size by End Use Industry 2022 - 2034
-
6.1.9.1 Asia Pacific Oil & Gas Market Size
-
6.1.9.2 Asia Pacific Metallurgy Market Size
-
6.1.9.3 Asia Pacific Automotive Market Size
-
6.1.9.4 Asia Pacific Food & Beverages Market Size
-
6.1.9.5 Asia Pacific Chemicals Market Size
-
6.1.9.6 Asia Pacific Others Market Size
-
-
6.1.10 Asia Pacific Cryogenic Equipment Volume Market Sales by End Use Industry 2022 - 2034
-
6.1.10.1 Asia Pacific Oil & Gas Sales Volume
-
6.1.10.2 Asia Pacific Metallurgy Sales Volume
-
6.1.10.3 Asia Pacific Automotive Sales Volume
-
6.1.10.4 Asia Pacific Food & Beverages Sales Volume
-
6.1.10.5 Asia Pacific Chemicals Sales Volume
-
6.1.10.6 Asia Pacific Others Sales Volume
-
-
This chapter will help you gain South America Market Analysis of Cryogenic Equipment. Further deep in this chapter, you will be able to review South America Cryogenic Equipment Market Split by various segments and Country Split.
Chapter 7 South America Market Analysis
-
7.1 South America Cryogenic Equipment Market Outlook
-
7.1.1 South America Cryogenic Equipment Market Size 2022 - 2034
-
7.1.2 South America Cryogenic Equipment Volume Market Sales 2022 - 2034
-
7.1.3 South America Cryogenic Equipment Market Size By Country 2022 - 2034
-
7.1.4 South America Cryogenic Equipment Volume Market Sales By Country 2022 - 2034
-
7.1.5 South America Cryogenic Equipment Market Size by Type 2022 - 2034
-
7.1.5.1 South America Tanks Market Size
-
7.1.5.2 South America Valves Market Size
-
7.1.5.3 South America Pumps & Vaporizers Market Size
-
7.1.5.4 South America Vacuum Jacketed Piping Market Size
-
-
7.1.6 South America Cryogenic Equipment Volume Market Sales by Type 2022 - 2034
-
7.1.6.1 South America Tanks Sales Volume
-
7.1.6.2 South America Valves Sales Volume
-
7.1.6.3 South America Pumps & Vaporizers Sales Volume
-
7.1.6.4 South America Vacuum Jacketed Piping Sales Volume
-
-
7.1.7 South America Cryogenic Equipment Market Size by Cryogen 2022 - 2034
-
7.1.7.1 South America Nitrogen Market Size
-
7.1.7.2 South America Oxygen Market Size
-
7.1.7.3 South America Argon Market Size
-
7.1.7.4 South America Liquefied Natural Gas (LNG) Market Size
-
-
7.1.8 South America Cryogenic Equipment Volume Market Sales by Cryogen 2022 - 2034
-
7.1.8.1 South America Nitrogen Sales Volume
-
7.1.8.2 South America Oxygen Sales Volume
-
7.1.8.3 South America Argon Sales Volume
-
7.1.8.4 South America Liquefied Natural Gas (LNG) Sales Volume
-
-
7.1.9 South America Cryogenic Equipment Market Size by End Use Industry 2022 - 2034
-
7.1.9.1 South America Oil & Gas Market Size
-
7.1.9.2 South America Metallurgy Market Size
-
7.1.9.3 South America Automotive Market Size
-
7.1.9.4 South America Food & Beverages Market Size
-
7.1.9.5 South America Chemicals Market Size
-
7.1.9.6 South America Others Market Size
-
-
7.1.10 South America Cryogenic Equipment Volume Market Sales by End Use Industry 2022 - 2034
-
7.1.10.1 South America Oil & Gas Sales Volume
-
7.1.10.2 South America Metallurgy Sales Volume
-
7.1.10.3 South America Automotive Sales Volume
-
7.1.10.4 South America Food & Beverages Sales Volume
-
7.1.10.5 South America Chemicals Sales Volume
-
7.1.10.6 South America Others Sales Volume
-
-
This chapter will help you gain Middle East Market Analysis of Cryogenic Equipment. Further deep in this chapter, you will be able to review Middle East Cryogenic Equipment Market Split by various segments and Country Split.
Chapter 8 Middle East Market Analysis
-
8.1 Middle East Cryogenic Equipment Market Outlook
-
8.1.1 Middle East Cryogenic Equipment Market Size 2022 - 2034
-
8.1.2 Middle East Cryogenic Equipment Volume Market Sales 2022 - 2034
-
8.1.3 Middle East Cryogenic Equipment Market Size By Country 2022 - 2034
-
8.1.4 Middle East Cryogenic Equipment Volume Market Sales By Country 2022 - 2034
-
8.1.5 Middle East Cryogenic Equipment Market Size by Type 2022 - 2034
-
8.1.5.1 Middle East Tanks Market Size
-
8.1.5.2 Middle East Valves Market Size
-
8.1.5.3 Middle East Pumps & Vaporizers Market Size
-
8.1.5.4 Middle East Vacuum Jacketed Piping Market Size
-
-
8.1.6 Middle East Cryogenic Equipment Volume Market Sales by Type 2022 - 2034
-
8.1.6.1 Middle East Tanks Sales Volume
-
8.1.6.2 Middle East Valves Sales Volume
-
8.1.6.3 Middle East Pumps & Vaporizers Sales Volume
-
8.1.6.4 Middle East Vacuum Jacketed Piping Sales Volume
-
-
8.1.7 Middle East Cryogenic Equipment Market Size by Cryogen 2022 - 2034
-
8.1.7.1 Middle East Nitrogen Market Size
-
8.1.7.2 Middle East Oxygen Market Size
-
8.1.7.3 Middle East Argon Market Size
-
8.1.7.4 Middle East Liquefied Natural Gas (LNG) Market Size
-
-
8.1.8 Middle East Cryogenic Equipment Volume Market Sales by Cryogen 2022 - 2034
-
8.1.8.1 Middle East Nitrogen Sales Volume
-
8.1.8.2 Middle East Oxygen Sales Volume
-
8.1.8.3 Middle East Argon Sales Volume
-
8.1.8.4 Middle East Liquefied Natural Gas (LNG) Sales Volume
-
-
8.1.9 Middle East Cryogenic Equipment Market Size by End Use Industry 2022 - 2034
-
8.1.9.1 Middle East Oil & Gas Market Size
-
8.1.9.2 Middle East Metallurgy Market Size
-
8.1.9.3 Middle East Automotive Market Size
-
8.1.9.4 Middle East Food & Beverages Market Size
-
8.1.9.5 Middle East Chemicals Market Size
-
8.1.9.6 Middle East Others Market Size
-
-
8.1.10 Middle East Cryogenic Equipment Volume Market Sales by End Use Industry 2022 - 2034
-
8.1.10.1 Middle East Oil & Gas Sales Volume
-
8.1.10.2 Middle East Metallurgy Sales Volume
-
8.1.10.3 Middle East Automotive Sales Volume
-
8.1.10.4 Middle East Food & Beverages Sales Volume
-
8.1.10.5 Middle East Chemicals Sales Volume
-
8.1.10.6 Middle East Others Sales Volume
-
-
This chapter will help you gain Middle East Market Analysis of Cryogenic Equipment. Further deep in this chapter, you will be able to review Middle East Cryogenic Equipment Market Split by various segments and Country Split.
Chapter 9 Africa Market Analysis
-
9.1 Africa Cryogenic Equipment Market Outlook
-
9.1.1 Africa Cryogenic Equipment Market Size 2022 - 2034
-
9.1.2 Africa Cryogenic Equipment Volume Market Sales 2022 - 2034
-
9.1.3 Africa Cryogenic Equipment Market Size By Country 2022 - 2034
-
9.1.4 Africa Cryogenic Equipment Volume Market Sales By Country 2022 - 2034
-
9.1.5 Africa Cryogenic Equipment Market Size by Type 2022 - 2034
-
9.1.5.1 Africa Tanks Market Size
-
9.1.5.2 Africa Valves Market Size
-
9.1.5.3 Africa Pumps & Vaporizers Market Size
-
9.1.5.4 Africa Vacuum Jacketed Piping Market Size
-
-
9.1.6 Africa Cryogenic Equipment Volume Market Sales by Type 2022 - 2034
-
9.1.6.1 Africa Tanks Sales Volume
-
9.1.6.2 Africa Valves Sales Volume
-
9.1.6.3 Africa Pumps & Vaporizers Sales Volume
-
9.1.6.4 Africa Vacuum Jacketed Piping Sales Volume
-
-
9.1.7 Africa Cryogenic Equipment Market Size by Cryogen 2022 - 2034
-
9.1.7.1 Africa Nitrogen Market Size
-
9.1.7.2 Africa Oxygen Market Size
-
9.1.7.3 Africa Argon Market Size
-
9.1.7.4 Africa Liquefied Natural Gas (LNG) Market Size
-
-
9.1.8 Africa Cryogenic Equipment Volume Market Sales by Cryogen 2022 - 2034
-
9.1.8.1 Africa Nitrogen Sales Volume
-
9.1.8.2 Africa Oxygen Sales Volume
-
9.1.8.3 Africa Argon Sales Volume
-
9.1.8.4 Africa Liquefied Natural Gas (LNG) Sales Volume
-
-
9.1.9 Africa Cryogenic Equipment Market Size by End Use Industry 2022 - 2034
-
9.1.9.1 Africa Oil & Gas Market Size
-
9.1.9.2 Africa Metallurgy Market Size
-
9.1.9.3 Africa Automotive Market Size
-
9.1.9.4 Africa Food & Beverages Market Size
-
9.1.9.5 Africa Chemicals Market Size
-
9.1.9.6 Africa Others Market Size
-
-
9.1.10 Africa Cryogenic Equipment Volume Market Sales by End Use Industry 2022 - 2034
-
9.1.10.1 Africa Oil & Gas Sales Volume
-
9.1.10.2 Africa Metallurgy Sales Volume
-
9.1.10.3 Africa Automotive Sales Volume
-
9.1.10.4 Africa Food & Beverages Sales Volume
-
9.1.10.5 Africa Chemicals Sales Volume
-
9.1.10.6 Africa Others Sales Volume
-
-
This chapter provides an in-depth analysis of the market share among key competitors of Cryogenic Equipment. The analysis highlights each competitor's position in the market, growth trends, and financial performance, offering insights into competitive dynamics, and emerging players.
Chapter 10 Competitor Analysis (Subject to Data Availability (Private Players))
-
10.1 Top Competitors Analysis
-
10.1.1 Global Cryogenic Equipment Market Revenue and Share by Key Players
(Subject to Data Availability (Private Players))
-
10.1.2 Global Cryogenic Equipment Market Volume and Share by Key Players
-
10.1.3 Top Players Ranking 2024
-
10.1.4 New Product Launch Analysis
-
10.1.5 Industry Mergers and Acquisition Analysis
-
-
10.2 Company Profile (Data Subject to Availability) Sample Format
-
10.2.1 Air Liquide
Data Subject to Availability as we consider Top competitors and their market share will be delivered.
-
10.2.1.1 Company Basic Information, Manufacturing Base, Sales Area, and Competitors
-
10.2.1.2 Business Overview
-
10.2.1.3 Financials (Subject to data availability)
-
10.2.1.4 R&D Investment (Subject to data availability)
-
10.2.1.5 Product Types Specification
-
10.2.1.6 Business Strategy
-
10.2.1.7 Recent Developments
-
10.2.1.8 Management Change
-
10.2.1.9 S.W.O.T Analysis
-
-
10.2.2 Linde Group AG
Data Subject to Availability as we consider Top competitors and their market share will be delivered.
-
10.2.2.1 Company Basic Information, Manufacturing Base, Sales Area, and Competitors
-
10.2.2.2 Business Overview
-
10.2.2.3 Financials (Subject to data availability)
-
10.2.2.4 R&D Investment (Subject to data availability)
-
10.2.2.5 Product Types Specification
-
10.2.2.6 Business Strategy
-
10.2.2.7 Recent Developments
-
10.2.2.8 Management Change
-
10.2.2.9 S.W.O.T Analysis
-
-
10.2.3 Chart Industries
Data Subject to Availability as we consider Top competitors and their market share will be delivered.
-
10.2.3.1 Company Basic Information, Manufacturing Base, Sales Area, and Competitors
-
10.2.3.2 Business Overview
-
10.2.3.3 Financials (Subject to data availability)
-
10.2.3.4 R&D Investment (Subject to data availability)
-
10.2.3.5 Product Types Specification
-
10.2.3.6 Business Strategy
-
10.2.3.7 Recent Developments
-
10.2.3.8 Management Change
-
10.2.3.9 S.W.O.T Analysis
-
-
10.2.4 Cryofab
Data Subject to Availability as we consider Top competitors and their market share will be delivered.
-
10.2.4.1 Company Basic Information, Manufacturing Base, Sales Area, and Competitors
-
10.2.4.2 Business Overview
-
10.2.4.3 Financials (Subject to data availability)
-
10.2.4.4 R&D Investment (Subject to data availability)
-
10.2.4.5 Product Types Specification
-
10.2.4.6 Business Strategy
-
10.2.4.7 Recent Developments
-
10.2.4.8 Management Change
-
10.2.4.9 S.W.O.T Analysis
-
-
10.2.5 Cryoquip
Data Subject to Availability as we consider Top competitors and their market share will be delivered.
-
10.2.5.1 Company Basic Information, Manufacturing Base, Sales Area, and Competitors
-
10.2.5.2 Business Overview
-
10.2.5.3 Financials (Subject to data availability)
-
10.2.5.4 R&D Investment (Subject to data availability)
-
10.2.5.5 Product Types Specification
-
10.2.5.6 Business Strategy
-
10.2.5.7 Recent Developments
-
10.2.5.8 Management Change
-
10.2.5.9 S.W.O.T Analysis
-
-
10.2.6 Herose Gmbh
Data Subject to Availability as we consider Top competitors and their market share will be delivered.
-
10.2.6.1 Company Basic Information, Manufacturing Base, Sales Area, and Competitors
-
10.2.6.2 Business Overview
-
10.2.6.3 Financials (Subject to data availability)
-
10.2.6.4 R&D Investment (Subject to data availability)
-
10.2.6.5 Product Types Specification
-
10.2.6.6 Business Strategy
-
10.2.6.7 Recent Developments
-
10.2.6.8 Management Change
-
10.2.6.9 S.W.O.T Analysis
-
-
10.2.7 Inox India
Data Subject to Availability as we consider Top competitors and their market share will be delivered.
-
10.2.7.1 Company Basic Information, Manufacturing Base, Sales Area, and Competitors
-
10.2.7.2 Business Overview
-
10.2.7.3 Financials (Subject to data availability)
-
10.2.7.4 R&D Investment (Subject to data availability)
-
10.2.7.5 Product Types Specification
-
10.2.7.6 Business Strategy
-
10.2.7.7 Recent Developments
-
10.2.7.8 Management Change
-
10.2.7.9 S.W.O.T Analysis
-
-
10.2.8 Taylor Wharton International
Data Subject to Availability as we consider Top competitors and their market share will be delivered.
-
10.2.8.1 Company Basic Information, Manufacturing Base, Sales Area, and Competitors
-
10.2.8.2 Business Overview
-
10.2.8.3 Financials (Subject to data availability)
-
10.2.8.4 R&D Investment (Subject to data availability)
-
10.2.8.5 Product Types Specification
-
10.2.8.6 Business Strategy
-
10.2.8.7 Recent Developments
-
10.2.8.8 Management Change
-
10.2.8.9 S.W.O.T Analysis
-
-
10.2.9 VRV S.P.A.
Data Subject to Availability as we consider Top competitors and their market share will be delivered.
-
10.2.9.1 Company Basic Information, Manufacturing Base, Sales Area, and Competitors
-
10.2.9.2 Business Overview
-
10.2.9.3 Financials (Subject to data availability)
-
10.2.9.4 R&D Investment (Subject to data availability)
-
10.2.9.5 Product Types Specification
-
10.2.9.6 Business Strategy
-
10.2.9.7 Recent Developments
-
10.2.9.8 Management Change
-
10.2.9.9 S.W.O.T Analysis
-
-
10.2.10 Wessington Cryogenics
Data Subject to Availability as we consider Top competitors and their market share will be delivered.
-
10.2.10.1 Company Basic Information, Manufacturing Base, Sales Area, and Competitors
-
10.2.10.2 Business Overview
-
10.2.10.3 Financials (Subject to data availability)
-
10.2.10.4 R&D Investment (Subject to data availability)
-
10.2.10.5 Product Types Specification
-
10.2.10.6 Business Strategy
-
10.2.10.7 Recent Developments
-
10.2.10.8 Management Change
-
10.2.10.9 S.W.O.T Analysis
-
-
10.2.11 Beijing Tianhai Industry
Data Subject to Availability as we consider Top competitors and their market share will be delivered.
-
10.2.11.1 Company Basic Information, Manufacturing Base, Sales Area, and Competitors
-
10.2.11.2 Business Overview
-
10.2.11.3 Financials (Subject to data availability)
-
10.2.11.4 R&D Investment (Subject to data availability)
-
10.2.11.5 Product Types Specification
-
10.2.11.6 Business Strategy
-
10.2.11.7 Recent Developments
-
10.2.11.8 Management Change
-
10.2.11.9 S.W.O.T Analysis
-
-
This chapter would comprehensively cover market drivers, trends, restraints, opportunities, and various in-depth analyses like industrial chain, PESTEL, Porter’s Five Forces, and ESG, among others. It would also include product life cycle, technological advancements, and patent insights.
Chapter 11 Qualitative Analysis (Subject to Data Availability)
-
11.1 Market Drivers
-
11.2 Market Restraints
-
11.3 Market Trends
-
11.4 Market Opportunity
-
11.5 Technological Road Map (Subject to Data Availability)
-
11.6 Product Life Cycle (Subject to Data Availability)
-
11.7 Customer and Buyer Behavior Analysis
-
11.7.1 Consumer Demographics and Target Audience Assessment
-
11.7.2 Consumer Purchase Behavior and Demand Assessment
-
11.7.3 Consumer Pricing Dynamics and Affordability Assessment
-
11.7.4 Digital Consumer Engagement and Online Adoption Analysis
-
11.7.5 Future Consumption Trends and Demand Evolution Analysis
-
11.7.6 Enterprise Procurement & Purchasing Behavior Analysis
-
11.7.7 Buyer Decision-Making & Purchase Influence Assessment
-
11.7.8 Customer Expectations & Service Experience Evaluation
-
11.7.9 Vendor Selection & Supplier Preference Analysis
-
11.7.10 Customer Retention & Loyalty Strategy Assessment
-
11.7.11 Pricing Sensitivity & Value Perception Analysis
-
11.7.12 Customer Segmentation & Demand Pattern Analysis
-
11.7.13 Relationship Management & Strategic Partnership Trends
-
-
11.8 Market Attractiveness Analysis
-
11.9 PESTEL Analysis
-
11.9.1 Political Factors
-
11.9.2 Economic Factors
-
11.9.3 Social Factors
-
11.9.4 Technological Factors
-
11.9.5 Legal Factors
-
11.9.6 Environmental Factors
-
-
11.10 Industrial Chain Analysis (Subject to Data Availability)
-
11.10.1 Industry Chain Analysis
-
11.10.2 Manufacturing Cost Analysis
-
11.10.3 Supply Side Analysis
-
11.10.3.1 Raw Material Analysis
-
11.10.3.2 Raw Material Procurement Analysis
-
11.10.3.3 Raw Material Price Trend Analysis
-
-
-
11.11 Porter’s Five Forces Analysis
-
11.11.1 Bargaining Power of Suppliers
-
11.11.2 Bargaining Power of Buyers
-
11.11.3 Threat of New Entrants
-
11.11.4 Threat of Substitutes
-
11.11.5 Degree of Competition
-
-
11.12 Patent Analysis (Subject to Data Availability)
-
11.13 ESG Analysis
Segmentation Type Analysis 2019 -2031, will provide market size split by Type. This Information is provided at Global Level, Regional Level and Top Countries Level The report with the segmentation perspective mentioned under this chapters will be delivered to you On Demand. So please let us know if you would like to receive this additional data as well. No additional cost will be applicable for the same.
Chapter 12 Market Split by Type Analysis 2022 - 2034
-
12.1 Tanks
-
12.1.1 Global Cryogenic Equipment Revenue Market Size and Share by Tanks 2022 - 2034
-
12.1.2 Global Cryogenic Equipment Volume Market Sales by Tanks 2022 - 2034
-
-
12.2 Valves
-
12.2.1 Global Cryogenic Equipment Revenue Market Size and Share by Valves 2022 - 2034
-
12.2.2 Global Cryogenic Equipment Volume Market Sales by Valves 2022 - 2034
-
-
12.3 Pumps & Vaporizers
-
12.3.1 Global Cryogenic Equipment Revenue Market Size and Share by Pumps & Vaporizers 2022 - 2034
-
12.3.2 Global Cryogenic Equipment Volume Market Sales by Pumps & Vaporizers 2022 - 2034
-
-
12.4 Vacuum Jacketed Piping
-
12.4.1 Global Cryogenic Equipment Revenue Market Size and Share by Vacuum Jacketed Piping 2022 - 2034
-
12.4.2 Global Cryogenic Equipment Volume Market Sales by Vacuum Jacketed Piping 2022 - 2034
-
The report with the segmentation perspective mentioned under this chapters will be delivered to you On Demand. So please let us know if you would like to receive this additional data as well. No additional cost will be applicable for the same.
Chapter 13 Market Split by Cryogen Analysis 2022 - 2034
-
13.1 Nitrogen
-
13.1.1 Global Cryogenic Equipment Revenue Market Size and Share by Nitrogen 2022 - 2034
-
13.1.2 Global Cryogenic Equipment Volume Market Sales by Nitrogen 2022 - 2034
-
-
13.2 Oxygen
-
13.2.1 Global Cryogenic Equipment Revenue Market Size and Share by Oxygen 2022 - 2034
-
13.2.2 Global Cryogenic Equipment Volume Market Sales by Oxygen 2022 - 2034
-
-
13.3 Argon
-
13.3.1 Global Cryogenic Equipment Revenue Market Size and Share by Argon 2022 - 2034
-
13.3.2 Global Cryogenic Equipment Volume Market Sales by Argon 2022 - 2034
-
-
13.4 Liquefied Natural Gas (LNG)
-
13.4.1 Global Cryogenic Equipment Revenue Market Size and Share by Liquefied Natural Gas (LNG) 2022 - 2034
-
13.4.2 Global Cryogenic Equipment Volume Market Sales by Liquefied Natural Gas (LNG) 2022 - 2034
-
The report with the segmentation perspective mentioned under this chapters will be delivered to you On Demand. So please let us know if you would like to receive this additional data as well. No additional cost will be applicable for the same.
Chapter 14 Market Split by End Use Industry Analysis 2022 - 2034
-
14.1 Oil & Gas
-
14.1.1 Global Cryogenic Equipment Revenue Market Size and Share by Oil & Gas 2022 - 2034
-
14.1.2 Global Cryogenic Equipment Volume Market Sales by Oil & Gas 2022 - 2034
-
-
14.2 Metallurgy
-
14.2.1 Global Cryogenic Equipment Revenue Market Size and Share by Metallurgy 2022 - 2034
-
14.2.2 Global Cryogenic Equipment Volume Market Sales by Metallurgy 2022 - 2034
-
-
14.3 Automotive
-
14.3.1 Global Cryogenic Equipment Revenue Market Size and Share by Automotive 2022 - 2034
-
14.3.2 Global Cryogenic Equipment Volume Market Sales by Automotive 2022 - 2034
-
-
14.4 Food & Beverages
-
14.4.1 Global Cryogenic Equipment Revenue Market Size and Share by Food & Beverages 2022 - 2034
-
14.4.2 Global Cryogenic Equipment Volume Market Sales by Food & Beverages 2022 - 2034
-
-
14.5 Chemicals
-
14.5.1 Global Cryogenic Equipment Revenue Market Size and Share by Chemicals 2022 - 2034
-
14.5.2 Global Cryogenic Equipment Volume Market Sales by Chemicals 2022 - 2034
-
-
14.6 Others
-
14.6.1 Global Cryogenic Equipment Revenue Market Size and Share by Others 2022 - 2034
-
14.6.2 Global Cryogenic Equipment Volume Market Sales by Others 2022 - 2034
-
Chapter 15 Cryogenic Equipment Price Trend Analysis
-
15.1 Global Cryogenic Equipment Price Trend Analysis
-
15.2 Global Cryogenic Equipment Price Trend Analysis By Region
-
15.3 North America Cryogenic Equipment Price Trend Analysis
-
15.4 Europe Cryogenic Equipment Price Trend Analysis
-
15.5 Asia Pacific Cryogenic Equipment Price Trend Analysis
-
15.6 South America Cryogenic Equipment Price Trend Analysis
-
15.7 Middle East Cryogenic Equipment Price Trend Analysis
-
15.8 Africa Cryogenic Equipment Price Trend Analysis
-
15.9 Cryogenic Equipment Price Trend Analysis By Type
-
15.9.1 Global Cryogenic Equipment Price Trend Analysis By Type
-
Chapter 16 Cryogenic Equipment Import/Export Analysis
-
16.1 Global Cryogenic Equipment Market Import Data (2022-2025)
-
16.2 Global Cryogenic Equipment Market Export Data (2019-2023)
-
16.3 Global Cryogenic Equipment Market Import Data by Region (2019-2023)
-
16.4 Global Cryogenic Equipment Market Export Data by Region (2019-2023)
-
16.5 North America Cryogenic Equipment Market Import Data by Country (2019-2023)
-
16.6 North America Cryogenic Equipment Market Export Data by Country (2019-2023)
-
16.7 Europe Cryogenic Equipment Market Import Data by Country (2019-2023)
-
16.8 Europe Cryogenic Equipment Market Export Data by Country (2019-2023)
-
16.9 Asia Pacific Cryogenic Equipment Market Import Data by Country (2019-2023)
-
16.10 Asia Pacific Cryogenic Equipment Market Export Data by Country (2019-2023)
-
16.11 South America Cryogenic Equipment Market Import Data by Country (2019-2023)
-
16.12 South America Cryogenic Equipment Market Export Data by Country (2019-2023)
-
16.13 Middle East and Africa Cryogenic Equipment Market Import Data by Country (2019-2023)
-
16.14 Middle East and Africa Cryogenic Equipment Market Export Data by Country (2019-2023)
Chapter 17 Cryogenic Equipment Production Analysis
-
17.1 Global Cryogenic Equipment Market Production Data (2022-2025)
-
17.2 Global Cryogenic Equipment Market Production by Region (2022-2025)
-
17.3 North America Cryogenic Equipment Production Analysis (2022-2025)
-
17.4 Europe Cryogenic Equipment Production Analysis (2022-2025)
-
17.5 Asia Pacific Cryogenic Equipment Production Analysis (2022-2025)
-
17.6 South America Cryogenic Equipment Production Analysis (2022-2025)
-
17.7 Middle East Cryogenic Equipment Production Analysis (2022-2025)
-
17.8 Africa Cryogenic Equipment Production Analysis (2022-2025)
-
17.9 Cryogenic Equipment Market Production Analysis By Company
-
17.9.1 Global Cryogenic Equipment Market Production Analysis By Company
-
17.9.2 North America Cryogenic Equipment Market Production Analysis By Company
-
17.9.3 Europe Cryogenic Equipment Market Production Analysis By Company
-
17.9.4 Asia Pacific Cryogenic Equipment Market Production Analysis By Company
-
17.9.5 South America Cryogenic Equipment Market Production Analysis By Company
-
17.9.6 Middle East Cryogenic Equipment Market Production Analysis By Company
-
17.9.7 Africa Cryogenic Equipment Market Production Analysis By Company
-
Chapter 18 Gap Analysis
-
18.1 Company Gap Assessment Analysis
-
18.2 Product & Service Portfolio Gap Analysis
-
18.3 Demand-Supply Imbalance Analysis
-
18.4 Market Opportunity & Unmet Needs Analysis
-
18.5 Technology Adoption & Digital Transformation Gap Analysis
-
18.6 Operational Efficiency & Process Gap Analysis
-
18.7 Infrastructure & Capacity Gap Analysis
-
18.8 Geographic Coverage & Distribution Gap Analysis
-
18.9 Investment Opportunity & Funding Gap Analysis
-
18.10 Pricing Structure & Margin Gap Analysis
-
18.11 Innovation & R&D Capability Gap Analysis
-
18.12 Policy, Compliance & Regulatory Gap Analysis
-
18.13 Customer Experience & Expectation Gap Analysis
-
18.14 Future Growth Opportunity Gap Analysis
-
18.15 Market Accessibility & Penetration Gap Analysis
Chapter 19 Strategy Analysis
-
19.1 Strategic Commercialization & Pricing Assessment
Chapter 20 Profitability and Gross Margin Analysis
-
20.1 Gross Margin Overview and Industry Profitability Trends
-
20.2 Regional Gross Margin Performance Analysis
-
20.3 Supply Chain and Distribution Impact on Gross Margins
-
20.4 Pricing Strategy and Value-Added Margin Assessment
-
20.5 Key Factors Influencing Gross Margin Variability
-
20.6 Future Gross Margin Outlook and Profitability Trends
Chapter 21 TAM Analysis
-
21.1 Global Cryogenic Equipment Market TAM Analysis
-
21.2 North America Cryogenic Equipment Market TAM Analysis
-
21.3 Europe Cryogenic Equipment Market TAM Analysis
-
21.4 Asia Pacific Cryogenic Equipment Market TAM Analysis
-
21.5 South America Cryogenic Equipment Market TAM Analysis
-
21.6 Middle East Cryogenic Equipment Market TAM Analysis
-
21.7 Africa Cryogenic Equipment Market TAM Analysis
This chapter helps you understand the Key Takeaways and Analyst Point of View of the global Cryogenic Equipment market
Chapter 22 Research Findings
-
22.1 Key Takeaways
-
22.2 Analyst Point of View
Here the analyst will summarize the content of entire report and will share his view point on the current industry scenario and how the market is expected to perform in the near future. The points shared by the analyst are based on his/her detailed in-depth understanding of the market during the course of this report study. You will be provided exclusive rights to interact with the concerned analyst for unlimited time pre purchase as well as post purchase of the report.
-
22.3 Assumptions and Acronyms
Chapter 23 Research Methodology and Sources
-
23.1 Primary Data Collection
-
23.1.1 Steps for Primary Data Collection
-
23.1.1.1 Identification of KOL
-
-
23.1.2 Backward Integration
-
23.1.3 Forward Integration
-
23.1.4 How Primary Research Help Us
-
23.1.5 Modes of Primary Research
-
-
23.2 Secondary Research
-
23.2.1 How Secondary Research Help Us
-
23.2.2 Sources of Secondary Research
-
-
23.3 Data Validation
-
23.3.1 Data Triangulation
-
23.3.2 Top Down & Bottom Up Approach
-
23.3.3 Cross check KOL Responses with Secondary Data
-
-
23.4 Data Representation
Sample Format of Deliverables
The Tables, Graphs/Charts are only for representative purposes and do not depict actual statistics. Purchase full Report access to actual data.
Qualitative Analysis
Cognitive's Full Truth Proprietary Research Methodology Implemented by Pratik Shirsath and Team
1 Data Gathering
-
1.1 Research Design & Problem Structuring
-
1.1.1 Identification of Research Objectives
-
1.1.2 Market, Region, and Timeframe Definition
-
1.1.3 Problem Decomposition & Hypothesis Development
-
1.1.4 Mapping Data Requirements & Analytical Framework
-
-
1.2 Data Architecture & Multi-Source Intelligence
-
1.2.1 Primary Research
-
1.2.1.1 Manufacturers, distributors, and traders
-
1.2.1.2 Procurement managers and industry buyers
-
1.2.1.3 Technology providers and innovators
-
1.2.1.4 Regulators and policy authorities
-
1.2.1.5 Subject-matter experts and consultants
-
1.2.1.6 End users across both B2B and B2C segments
-
-
1.2.2 Secondary Research
-
1.2.2.1 Public data sources
-
1.2.2.2 Paid Data Sources
-
-
1.2.3 Internal Knowledge Systems
-
2 Data Validation
-
2.1 Market Engineering & Quantitative Modelling
-
2.1.1 Market Sizing and Forecasting Approach
-
2.1.1.1 Market Sizing Techniques
-
2.1.1.2 Forecasting Models
-
-
-
2.2 Economic Modelling Framework
-
2.2.1 Cost Structure & Value Chain Economics
-
2.2.2 Demand & Price Elasticity Analysis
-
2.2.3 Supply–Demand Balance Assessment
-
2.2.4 Economic Impact Assessment
-
-
2.3 Industry Structure, Competition & Technology Analysis
-
2.3.1 Tools and Approaches Applied
-
-
2.4 Validation & Sensitivity Analysis
-
2.5 Insight Development & Recommendations
-
2.6 Transparent Documentation
3 Data Presentation
To maintain the integrity of our proprietary methodology and protect our elite expert network, specific source disclosures are reserved for our full-access partners. Our research framework is anchored by a 70:30 primary-to-secondary ratio, ensuring your strategy is driven by real-time market intelligence rather than recycled, publicly available, or AI-generated data. Every deliverable includes an exhaustive source directory and grants your team direct access to our lead analysts for bespoke strategic consultation.
Latest News about Cryogenic Equipment Market
Sources from Machinery & Equipment Industry
- https://dor.wa.gov/education/industry-guides/manufacturing-guide/machinery-and-equipment-defined
- https://www.ilo.org/global/topics/labour-administration-inspection/resources-library/publications/guide-for-labour-inspectors/machinery-plant-equipment/lang--en/index.htm
- https://heavyindustries.gov.in/
- https://agrimachinery.nic.in/
- http://www.imtma.in/
- http://www.worksafe.qld.gov.au
- http://www.bls.gov/
- http://www.bahamas.gov.bs/
- http://www.gov.uk
- http://www.i-cema.in/
- https://revenue.nebraska.gov/
- https://equipmentindia.com
- http://www.worksafe.govt.nz/
- http://www.cbp.gov
- http://www.hse.gov.uk/
- http://www.agrifarming.in/
- https://indbiz.gov.in/
- http://www.jetro.go.jp/
- http://www.trade.gov/
- http://www2.gov.bc.ca/
- http://www.federalreserve.gov